


Introduction to Technical Analysis for AI3 Trading
Technical indicators are mathematical tools used to analyze AI3 price movements and trading volumes, helping traders identify patterns and predict future price action. In the context of AI3, which is the native token of the Autonomys Network, technical analysis is especially relevant due to the token's high volatility and 24/7 trading environment. These indicators provide actionable signals for entry and exit points, allowing traders to navigate AI3's unique market dynamics without requiring deep knowledge of the Autonomys Network's underlying AI infrastructure. While fundamental analysis focuses on AI3's technological innovations—such as its modular execution environments and decentralized AI applications on the Autonomys Network—technical analysis leverages historical price and volume data to gauge market sentiment and direction. The most relevant tools for AI3 include trend-following indicators, momentum oscillators, and volume metrics, all of which help traders adapt to the token's rapid price changes and liquidity events on the Autonomys Network.
Essential Price-Based Indicators for AI3
- Moving Averages (Simple, Exponential): The 50-day and 200-day Simple Moving Averages (SMA) are widely used to identify key support and resistance levels for AI3 on the Autonomys Network. A 'golden cross' (50-day SMA crossing above the 200-day SMA) signals a bullish trend, while a 'death cross' indicates bearish momentum. Exponential Moving Averages (EMA) respond more quickly to recent price changes, making them suitable for AI3's fast-moving market.
- Bollinger Bands: These consist of a 20-day moving average with bands set at two standard deviations above and below. For AI3, Bollinger Bands help measure volatility and identify potential price breakouts. When AI3's price touches the upper band, it may be overbought; the lower band suggests oversold conditions. 'Bollinger Band squeezes' often precede major price movements in the Autonomys Network token.
- Support and Resistance Levels: Historical price data for AI3 reveals zones where buying or selling pressure consistently reverses price direction. These levels are crucial for setting stop-losses and profit targets when trading Autonomys Network's native token.
- Fibonacci Retracement: Traders use Fibonacci levels to identify potential reversal points in AI3's price trends, especially after sharp moves. Common retracement levels (38.2%, 50%, 61.8%) help pinpoint where corrections may end and trends resume for the Autonomys Network token.
Volume and Momentum Indicators for AI3
- Volume Analysis: Volume confirms the strength of AI3 price movements. High volume during breakouts suggests genuine momentum, while low volume may indicate weak or unsustainable trends. Volume spikes often coincide with major Autonomys Network announcements or new AI3 listings.
- Relative Strength Index (RSI): RSI measures the speed and change of AI3 price movements on a scale from 0 to 100. Readings above 70 indicate overbought conditions; below 30 suggest oversold. RSI divergences—where price makes a new high but RSI does not—can signal potential reversals for the Autonomys Network token.
- MACD (Moving Average Convergence Divergence): MACD tracks the relationship between two EMAs, helping traders spot momentum shifts in AI3 markets. Crossovers between the MACD line and the signal line often precede trend changes in the Autonomys Network ecosystem.
- On-Balance Volume (OBV): OBV aggregates volume to detect 'smart money' movements in AI3 markets. Rising OBV alongside price increases suggests accumulation, while falling OBV may indicate distribution of the Autonomys Network token.
Advanced Technical Indicators for AI3 Trading
- Ichimoku Cloud: This indicator provides a comprehensive view of AI3's trend, support, and resistance. When AI3 trades above the cloud, the trend is bullish; below the cloud, bearish. The cloud's thickness reflects the strength of support/resistance, and color changes can signal trend shifts for the Autonomys Network token.
- Stochastic Oscillator: This tool helps time market entries and exits for AI3 by comparing closing prices to the range over a set period. Readings above 80 indicate overbought conditions; below 20 suggest oversold conditions for the Autonomys Network's native token.
- Accumulation/Distribution Line: This indicator gauges buying and selling pressure on AI3 by combining price and volume data. A rising line signals accumulation, while a falling line indicates distribution across Autonomys Network markets.
- Average Directional Index (ADX): ADX measures the strength of AI3's trend, regardless of direction. Readings above 25 suggest a strong trend; below 20 indicate a sideways market. Combined with Directional Movement Indicators (DMI), ADX can also signal potential trend reversals for Autonomys Network's AI3 token.
Creating a Technical Analysis Strategy for AI3
- Combining Multiple Indicators: Effective AI3 trading strategies use a combination of trend, momentum, and volume indicators to confirm signals and filter out noise. For example, pairing Moving Averages with RSI and volume analysis provides a more robust view of Autonomys Network market conditions.
- Avoiding Redundancy: Use indicators that complement each other rather than overlap, to avoid information overload and conflicting signals when trading AI3 on the Autonomys Network.
- Backtesting Strategies: Before live trading, backtest your technical strategies using historical AI3 price data to validate their effectiveness across different Autonomys Network market conditions.
- Custom Indicators and Alerts: Trading platforms allow users to set custom parameters and alerts for AI3, optimizing strategies for its unique behavior within the Autonomys Network ecosystem.
- Adapting to Market Conditions: Test strategies across bull, bear, and sideways phases to ensure reliability in AI3's cyclical market environment as the Autonomys Network continues to develop.
Conclusion
Technical indicators offer valuable insights for timing AI3 trades, but should always be paired with sound risk management. No single indicator is foolproof—especially in AI3's volatile market—so diversifying your analytical approach is essential when trading this Autonomys Network token. MEXC provides a comprehensive trading platform with advanced charting tools and real-time AI3 data. For the latest price analysis, detailed charts, and up-to-date predictions on AI3's future movements, visit our MEXC AI3 Price Page, where you can monitor Autonomys Network market trends and make informed trading decisions.
Описание: Криптопульс использует возможности ИИ и открытые источники, чтобы мгновенно сообщать вам о самых актуальных трендах токенов. За экспертной аналитикой и подробной информацией перейдите на MEXC Обучение.
Статьи, размещенные на этой странице, взяты из открытых источников и представлены исключительно для информационных целей. Они не отражают позицию или взгляды MEXC. Все права принадлежат MEXC. Если вы считаете, что какой-либо контент нарушает права третьей стороны, пожалуйста, свяжитесь с service@support.mexc.com для оперативного удаления. MEXC не гарантирует точность, полноту или своевременность любого контента и не несет ответственности за любые действия, предпринятые на основе предоставленной информации. Содержание не является финансовым, юридическим или другим профессиональным советом, а также не должно интерпретироваться как рекомендация или одобрение со стороны MEXC. Для получения экспертных мнений и углубленного анализа посетите MEXC Обучение.
Узнайте больше о Gensyn
Подробнее
Как SpaceX зарабатывает деньги? Прибыльна ли компания? Реальную прибыль приносит только одно из трёх направлений

Прогноз цены акций MU: сможет ли «Майкрон» продолжить извлекать выгоду из бума ИИ-памяти?

Достигнет ли акция APLD уровня 106 долларов? Что на самом деле показывает спор о целевой цене Applied Digital
Последние новости о Gensyn
Подробнее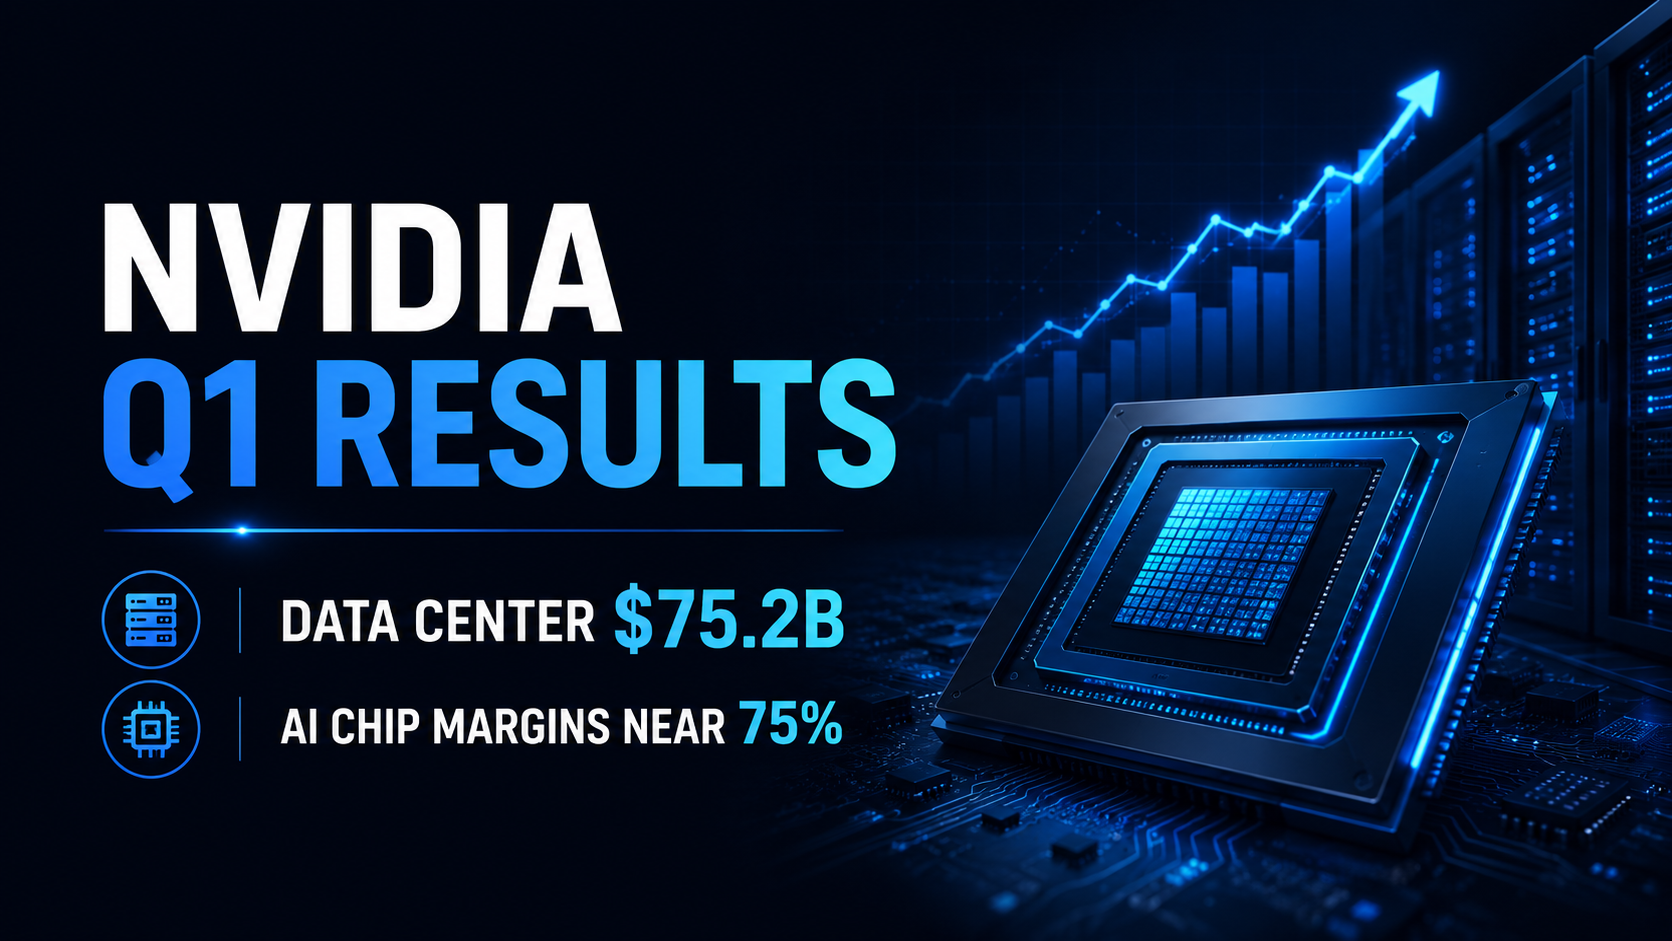
Обзор доходов Nvidia за Q1 FY2027: выручка дата-центров достигла $75,2 млрд, а маржа ИИ-чипов удерживается на уровне 75%

Обзор финансовых результатов Apple за 2 квартал 2026 финансового года: доходы от iPhone и рост сервисов поддерживают историю EPS

Ежедневный ончейн-отчет MEXC: дневной объем DEX в сети Robinhood Chain превысил 560 млн $


В тренде
Трендовые криптовалюты, которые в настоящее время привлекают значительное внимание рынка
Цены на криптовалюту
Криптовалюты с наибольшим объемом торгов
Недавно добавленные
Криптовалюты недавно внесенные в листинг и доступные для торговли