

Bitcoin (BTC) Crash Ripple Effects on Crypto Market: December 2025 Chain Reaction Assessment (Trader Guide)

Key Takeaways
- Bitcoin (BTC) crash cascades through crypto, $1.2T market cap wipeout, Ethereum -8.4% weekly to $2,800.
- Institutions outflow hits Solana -32% yearly, Dogecoin -26%, correlations at 0.8.
- Blockchain dev slows, DeFi TVL -15%, NFT volumes halved.
- MEXC stable trading hub with 100% reserves.
Core Overview
Price Dominoes: Altcoins Track BTC Down
- Solana: -32% YTD, DeFi liquidity drain, TVL -20%.
- Dogecoin: Meme fade -26%, hype cools.
DeFi & NFT Ecosystems: Liquidity Crunch Worsens
- Lending: Aave bad debt +2%, liquidations +30%.
- Blockchain Innovation: Dev activity -10%, funds to stables.
Institutions vs Retail: ETF Bleeds vs Whale Hoards
- Whales: Hoarded 381M BTC, short-term pressure heavy.
- Global: Emerging adoption -5%.
Regulation & Macro Spillover: Worldwide Risk Conduction
- Stocks: Nasdaq -3%, crypto follows.
- Long-Term: Blockchain funding -25%.
Conclusion
FAQs
How does BTC crash hit Ethereum?
NFT market damage?
Outflows on Solana?
Trading in downturn?
Description:Crypto Pulse is powered by AI and public sources to bring you the hottest token trends instantly. For expert insights and in-depth analysis, visit MEXC Learn.
The articles shared on this page are sourced from public platforms and are provided for informational purposes only. They do not necessarily represent the views of MEXC. All rights remain with the original authors. If you believe any content infringes upon third-party rights, please contact service@support.mexc.com for prompt removal.
MEXC does not guarantee the accuracy, completeness, or timeliness of any content and is not responsible for any actions taken based on the information provided. The content does not constitute financial, legal, or other professional advice, nor should it be interpreted as a recommendation or endorsement by MEXC.
Learn More About Bitcoin
View More
What Does BTC Mean in Text? Complete Guide to Bitcoin vs Slang

How to Short Bitcoin? How to Profit from BTC Price Drops?

How to Read a BTC Liquidation Map and Trade Smarter?
Latest Updates on Bitcoin
View More
Technische analyse: Bitcoin jaagt op herstel, XRP naar $1?
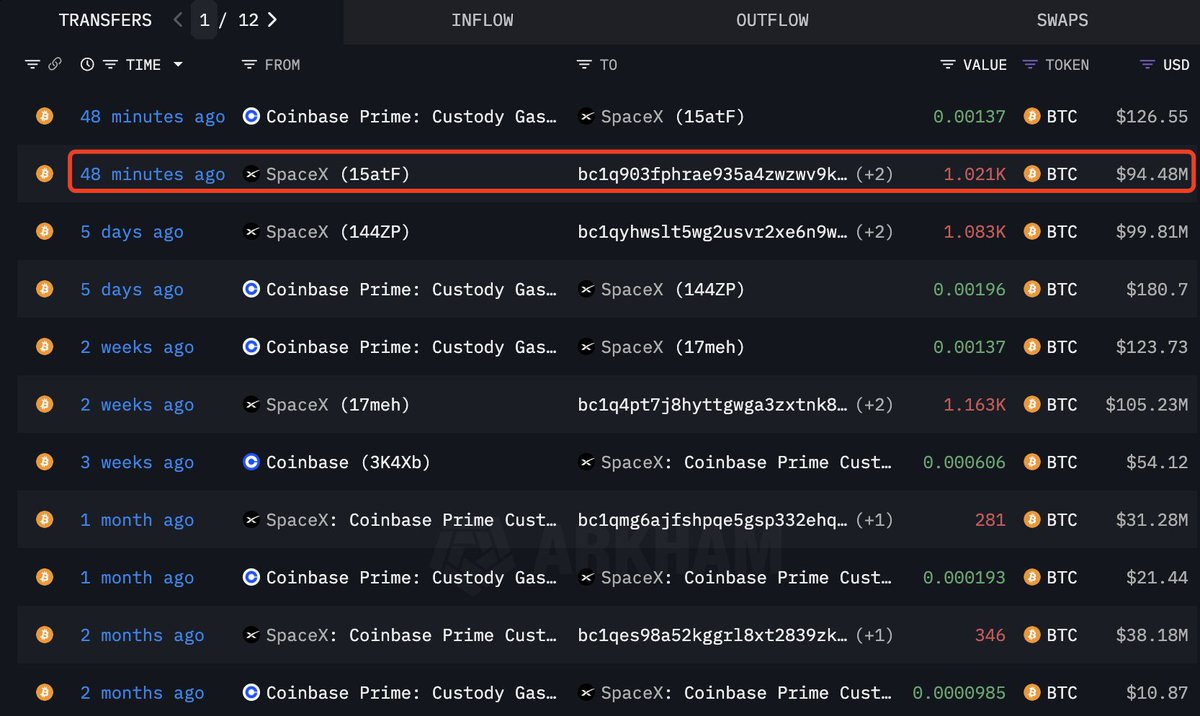
Elon Musk’s SpaceX Shifts $94.48M in Bitcoin with $1T IPO Predictions

Bitcoin Reclaims 50-Day MA as Market Odds for Fed Cut Hit 96%
HOT
Currently trending cryptocurrencies that are gaining significant market attention
Crypto Prices
The cryptocurrencies with the highest trading volume
Newly Added
Recently listed cryptocurrencies that are available for trading