


The live Bitcoin (BTC) price chart provides a dynamic view of market action, showing how traders and investors are positioning in real time. By studying Bitcoin price charts, you can identify momentum shifts, price patterns, and future trading opportunities with BTC technical analysis.
BTC Live Price Chart Overview
As of the latest data, BTC is trading at $87,569.26 USD, with a -2.45% change over the last 24 hours. Its trading volume stands at not specified in recent data, supported by a market capitalization of $1,748,114,488,139 USD.
- Current Price: $87,569.26 USD
- 24H Range: $85,500 – $90,472.45
- Market Rank: #1
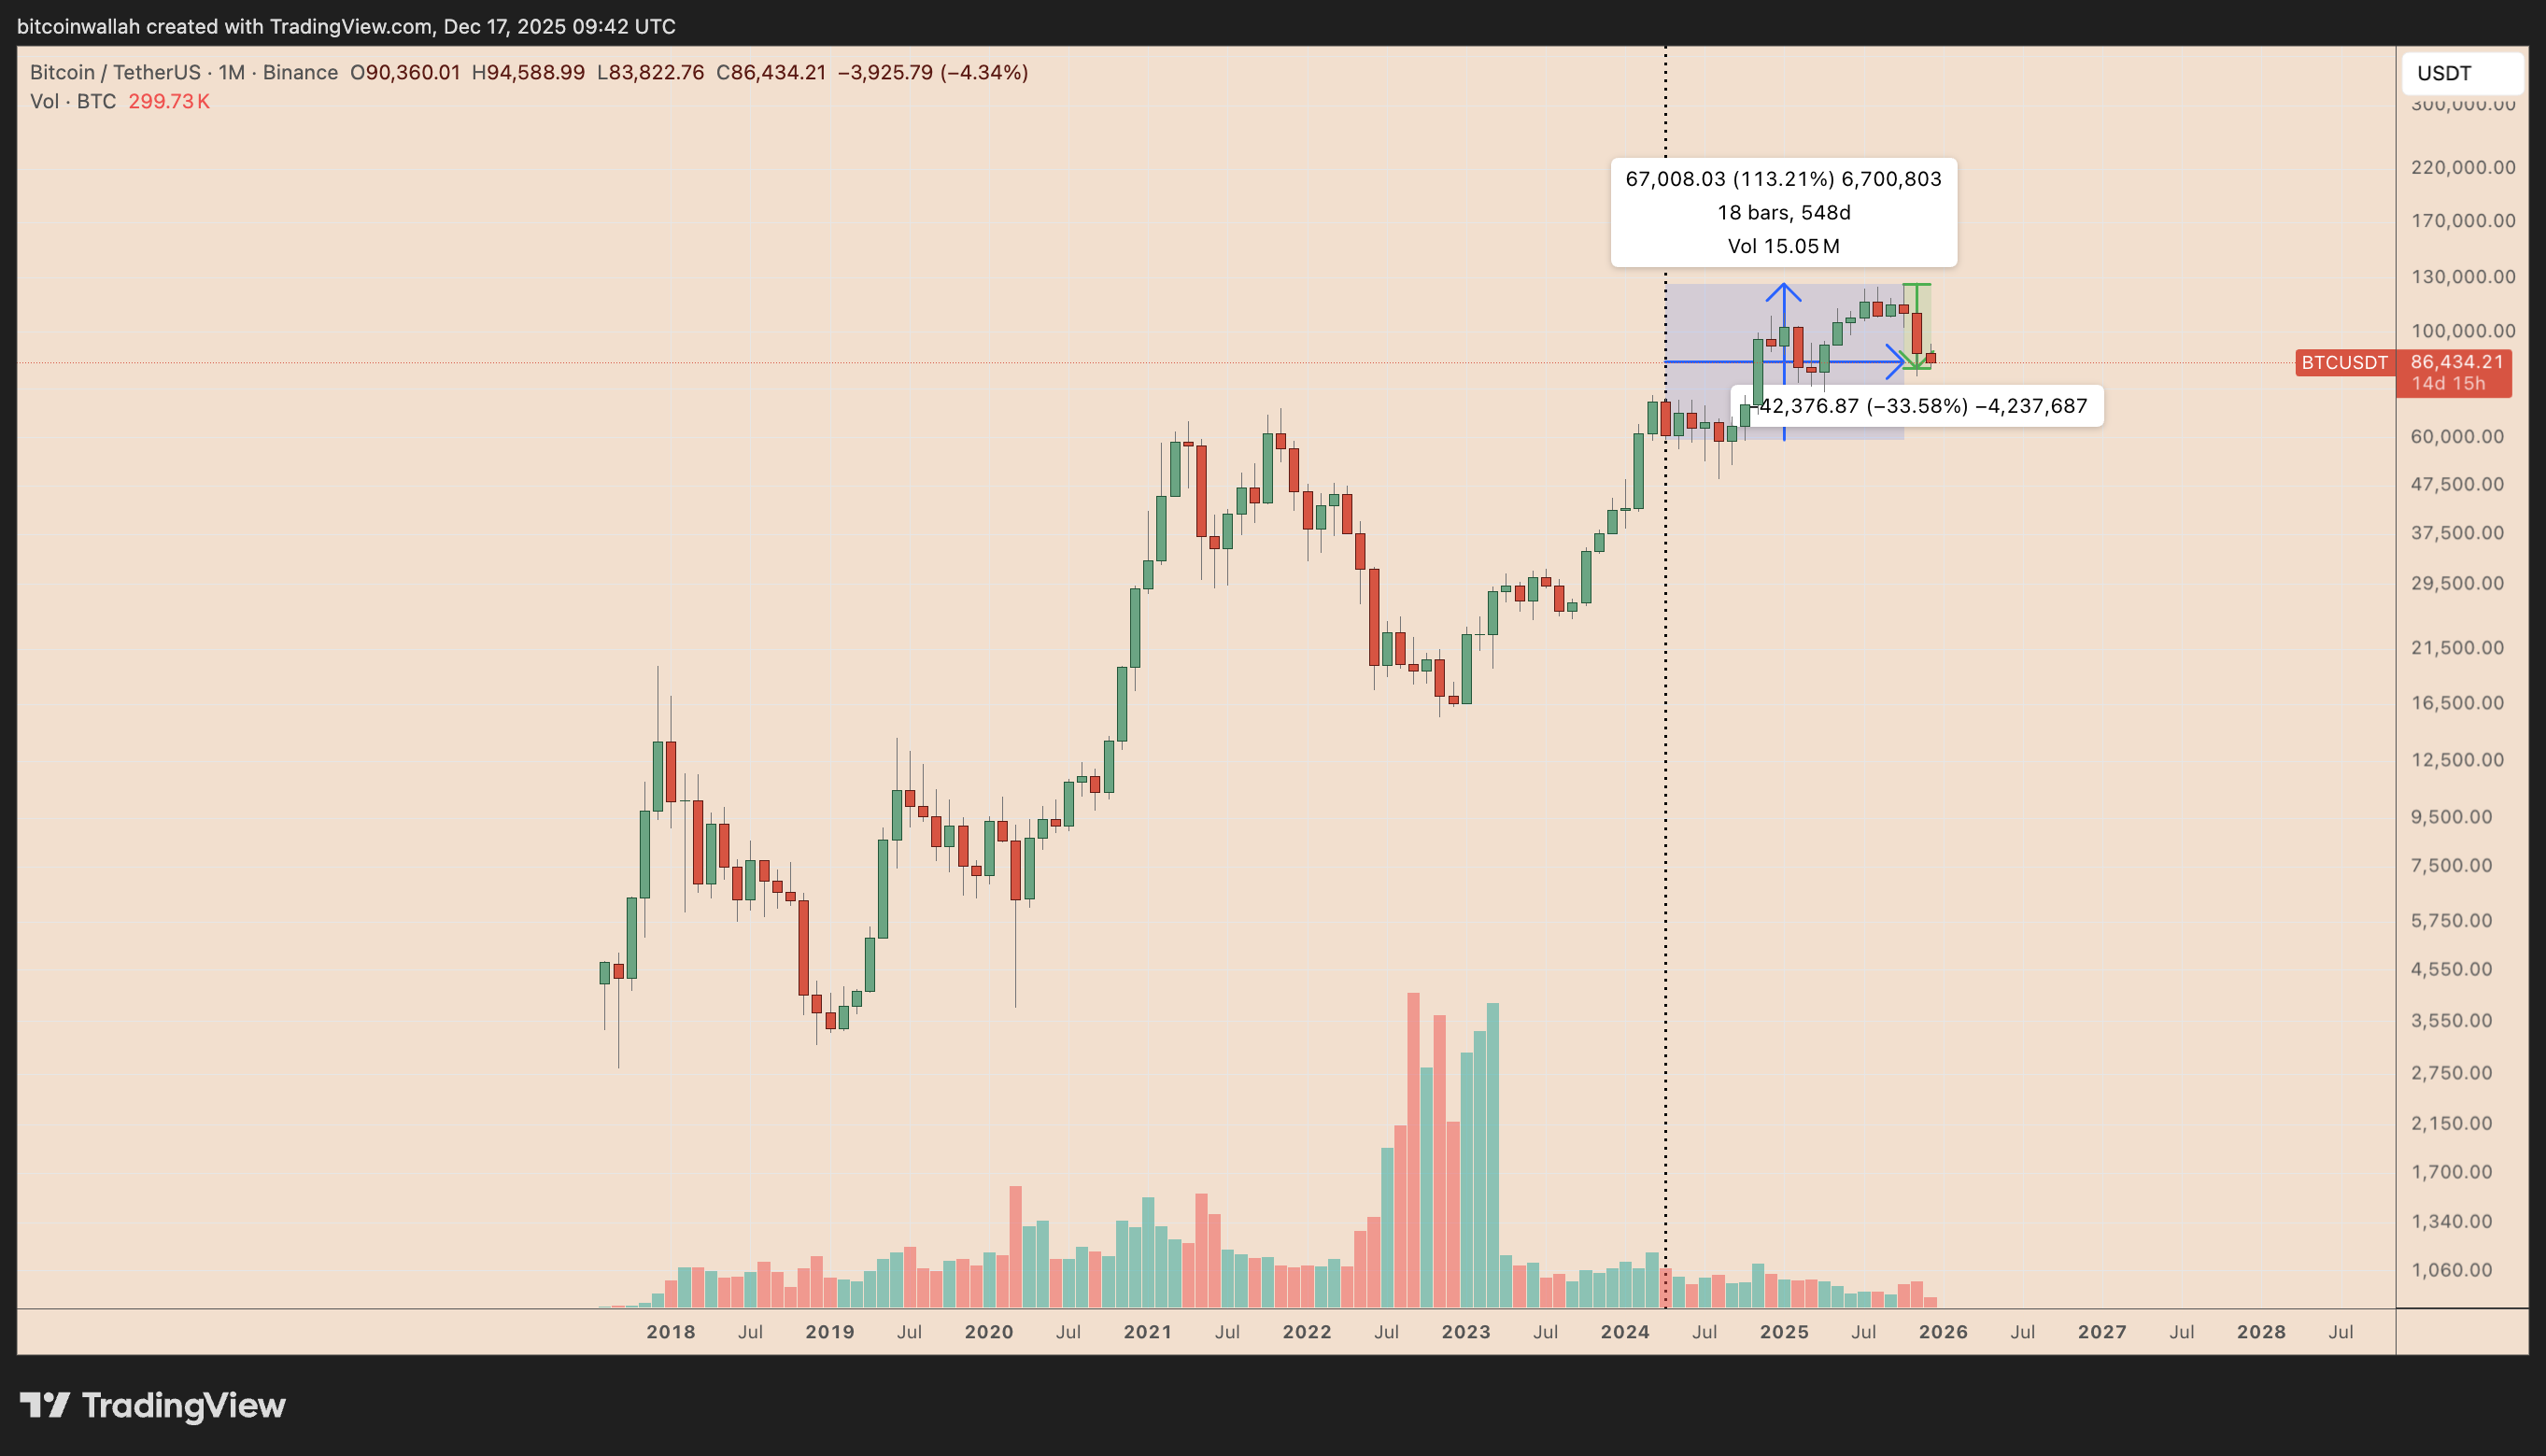
The Bitcoin price chart shows Bitcoin returning to weekly lows below $86,000 amid volatility, with recent support tests suggesting cautious trader positioning ahead of December's mixed seasonal patterns.
Intraday & 1-Week Chart Insights
On the 1-week Bitcoin price chart, BTC has traded between $85,500 and $92,750, covering a price range of approximately 8%. This range highlights whether the token is trending strongly or moving sideways.
Recent candles indicate consolidation with bearish pressure, as BTC slipped below key supports like $90,124, potentially eyeing deeper retests unless buyers defend $80,400.
How to Read the BTC Price Chart
Understanding the Bitcoin chart requires looking at several components:
- Candlesticks: These reveal market sentiment, with patterns like hammers, engulfing candles, or dojis often signaling shifts in momentum.
- Moving Averages (MA): Short- and long-term MAs show whether momentum is bullish, bearish, or neutral.
- Volume Trends: Spikes or drops in trading activity often precede major moves.
- Trendlines/Channels: These highlight long-term direction, whether BTC is in an uptrend, downtrend, or consolidating.
Key Technical Indicators (Dynamic)
Technical indicators add another layer of BTC technical analysis to the chart:
- RSI (Relative Strength Index): Near oversold levels post-17% November drop → indicates whether BTC is overbought, oversold, or neutral.
- MACD (Moving Average Convergence Divergence): Signals momentum shifts when the MACD line crosses the signal line.
- Bollinger Bands: Show volatility — compressed bands often precede big breakouts, while wide bands highlight ongoing volatility.
Bearish signals dominate with BTC below the bear flag lower band, but a liquidity sweep to $66,800-$80,400 could precede recovery if ETF inflows resume.
Historical Price Levels for BTC
Looking at Bitcoin price history helps put today's price in context:
- All-Time High (ATH): Not specified in recent data on Not specified
- All-Time Low (ATL): Not specified in recent data on Not specified
Comparing BTC's current price with these extremes highlights how far the token has come — and how much room there might still be for growth.
Support & Resistance Zones
Support and resistance zones are critical for traders using BTC technical analysis:
- Support Levels: $80,400, $85,000
- Resistance Levels: $90,124, $97,100
Support at $80,400 has acted as a rebound zone but remains fragile, while resistance near $97,100 could cap rallies unless volume confirms a breakout.
Conclusion
The BTC price chart offers more than just numbers — it reveals trader psychology, market patterns, and potential future moves. By combining candlestick patterns, volume data, and technical indicators through comprehensive BTC technical analysis, traders can make more informed decisions.
To keep track of the latest movements, check the live Bitcoin price chart on MEXC, where real-time data and trading opportunities are always available.
Mô tả: Nhịp đập tiền mã hoá áp dụng AI và các nguồn công khai để nhanh chóng mang đến những xu hướng token hot nhất. Để xem nhận định từ chuyên gia và phân tích chuyên sâu, vui lòng truy cập MEXC Learn.
Các bài viết được chia sẻ trên trang này được lấy từ các nền tảng công khai và chỉ nhằm mục đích tham khảo. Các bài viết này không nhất thiết đại diện cho quan điểm của MEXC. Mọi quyền sở hữu thuộc về tác giả gốc. Nếu bạn cho rằng bất kỳ nội dung nào vi phạm quyền của bên thứ ba, vui lòng liên hệ service@support.mexc.com để được xử lý kịp thời.
MEXC không đảm bảo tính chính xác, đầy đủ hoặc kịp thời của bất kỳ nội dung nào và không chịu trách nhiệm cho các hành động được thực hiện dựa trên thông tin cung cấp. Nội dung này không cấu thành lời khuyên tài chính, pháp lý hoặc chuyên môn khác, và cũng không được xem là khuyến nghị hoặc xác nhận từ MEXC.
Tìm hiểu thêm về Bitcoin
Xem thêm
Sự thống trị của BTC so với Altcoin: Hiểu động lực thị trường và cơ hội giao dịch

Cách Short Bitcoin? Cách Kiếm Lợi Nhuận Từ Giá BTC Giảm?

Cách Đọc Bản Đồ Thanh Lý BTC và Giao Dịch Thông Minh Hơn?
Cập nhật mới nhất về Bitcoin
Xem thêm
Micron phá vỡ kỳ vọng lợi nhuận, xoa dịu thị trường và giúp đẩy bitcoin trở lại trên mức $87,000
Sao chép liên kếtX (Twitter)LinkedInFacebookEmail
Chu kỳ 4 năm của Bitcoin đã bị phá vỡ và thị trường bò thực sự đã kết thúc?

Bitcoin hướng tới mức $90k trước CPI: Xem dự báo
HOT
Tiền mã hoá thịnh hành hiện nay đang thu hút sự chú ý đáng kể của thị trường
Giá tiền mã hoá
Tiền mã hoá có khối lượng giao dịch cao nhất
Mới được thêm vào
Tiền mã hoá được niêm yết gần đây có thể giao dịch