


Introduction to Technical Analysis for AI3 Trading
Technical analysis is a methodology for evaluating investments by analyzing statistical trends from trading activity, such as price movements and volume. For AI3 and Autonomys Network traders, this approach provides a framework for decision-making in a market known for high volatility. Unlike fundamental analysis, which examines project fundamentals and utility, technical analysis focuses on price patterns and trading signals to identify potential opportunities. This approach is especially relevant for AI3 trading because cryptocurrency markets often respond strongly to technical levels and display recurring patterns that can be identified by skilled traders. With AI3's 24/7 trading availability on the Autonomys Network, technical analysis offers systematic methods to identify potential entry and exit points across different timeframes. Essential tools covered in this article include chart patterns, technical indicators, advanced strategies, and practical application on the MEXC platform for AI3 trading.
Chart Patterns and Price Action Analysis for AI3
Key chart patterns for AI3 trading include support and resistance levels, which mark price points where AI3 has historically reversed direction. Trend lines connect successive highs or lows to visualize the market direction on the Autonomys Network. Traders should watch for common reversal patterns like head and shoulders and double tops/bottoms, which signal potential trend changes in AI3, and continuation patterns such as flags, pennants, and triangles that suggest temporary pauses before trend resumption. Price action analysis examines raw AI3 price movements through candlestick formations without heavy reliance on indicators. Important signals include engulfing patterns, pin bars, and inside bars, which can indicate potential reversals when analyzed within the broader Autonomys Network market context. Successful AI3 traders often combine multiple pattern recognition approaches for more reliable trading signals.
Essential Technical Indicators for AI3 Trading
Moving averages (Simple, Exponential, VWAP) smooth out AI3 price data to reveal trends. The Simple Moving Average (SMA) calculates the average price over a specified period, while the Exponential Moving Average (EMA) gives greater weight to recent prices. Traders watch for moving average crossovers like the golden cross (bullish) or death cross (bearish) when trading AI3 on the Autonomys Network.
Momentum indicators help identify overbought or oversold conditions for AI3. The Relative Strength Index (RSI) measures price change velocity on a scale from 0-100, with readings above 70 suggesting overbought conditions and below 30 indicating oversold conditions. The MACD tracks relationships between moving averages, generating signals when lines cross.
Volume-based indicators confirm AI3 price movements, helping traders validate the strength of a trend within the Autonomys Network ecosystem.
Volatility indicators like Bollinger Bands and ATR help identify potential breakout points and gauge market conditions for AI3.
For effective analysis, combine complementary indicators that provide different perspectives on AI3 and Autonomys Network rather than multiple tools that generate similar signals.
Advanced Technical Analysis Strategies for AI3
Multiple timeframe analysis involves examining AI3 charts across different time periods to gain comprehensive market insight. Start with higher timeframes to identify the main trend, then use shorter timeframes for precise entry timing. This approach helps align trades with dominant market forces while reducing false signals on the Autonomys Network.
Divergence trading identifies situations where AI3 price movement doesn't match indicator direction. Bullish divergence occurs when price makes lower lows while an indicator makes higher lows, suggesting potential upward reversal. These non-confirmations often precede significant AI3 price movements.
Fibonacci retracement tools identify potential support/resistance levels at key percentages (23.6%, 38.2%, 50%, 61.8%, 78.6%) for AI3, with the 61.8% level considered particularly significant in Autonomys Network trading.
Ichimoku Cloud analysis provides multiple analytical insights through a single complex indicator, helping traders identify trends and potential reversals in AI3.
Integration of on-chain metrics with technical analysis can further enhance AI3 and Autonomys Network trading by providing additional context on network activity and token flows.
Implementing Technical Analysis on MEXC for AI3 Trading
MEXC offers comprehensive charting tools for AI3 technical analysis on the Autonomys Network. Access these by navigating to the AI3 trading page and selecting 'Chart'. The platform supports multiple chart types and timeframes from 1-minute to 1-month. Customize your analysis by adding indicators through the indicator menu and adjusting parameters to match your AI3 trading strategy. Use MEXC's drawing tools to mark support/resistance levels and chart patterns directly on charts. Set up alerts to receive notifications when AI3 reaches specific prices or indicators generate signals, allowing you to capture opportunities without constant monitoring. When executing trades based on your analysis, utilize MEXC's various order types including limit, market, stop-limit, and OCO orders to implement your Autonomys Network strategy with precision and proper risk management.
Conclusion
Technical analysis equips AI3 traders with structured methods to interpret market movements and make data-driven decisions within the Autonomys Network ecosystem. MEXC provides all the essential tools you need to apply these techniques effectively for AI3, from basic chart patterns to advanced indicators. While no strategy guarantees profits, combining technical analysis with proper risk management significantly improves your trading outcomes on the Autonomys Network. Ready to put these technical analysis tools into practice? Visit MEXC's AI3 Price page to access real-time charts, apply the indicators discussed, and start trading with confidence. The comprehensive trading interface offers everything you need to analyze AI3's price movements on the Autonomys Network and execute informed trades, all on one secure platform.
Статьи, размещенные на этой странице, взяты из открытых источников и представлены исключительно для информационных целей. Они не отражают позицию или взгляды MEXC. Все права принадлежат MEXC. Если вы считаете, что какой-либо контент нарушает права третьей стороны, пожалуйста, свяжитесь с service@support.mexc.com для оперативного удаления. MEXC не гарантирует точность, полноту или своевременность любого контента и не несет ответственности за любые действия, предпринятые на основе предоставленной информации. Содержание не является финансовым, юридическим или другим профессиональным советом, а также не должно интерпретироваться как рекомендация или одобрение со стороны MEXC. Для получения экспертных мнений и углубленного анализа посетите MEXC Обучение.
Узнайте больше о Gensyn
Подробнее
Лучшая биржа для AI-токенов: 9 криптоплатформ, 4 AI-монеты, полное покрытие — только у двух

Меняет ли AI inference цикл NAND? Что история Sandisk означает для акций памяти

Что такое ETF Invesco QQQ? Активы индекса NASDAQ-100, стратегия, комиссии и риски
Последние новости о Gensyn
Подробнее
SK Hynix против Micron: Как грядущий листинг SKHY переоценит ИИ-память и лидерство в HBM
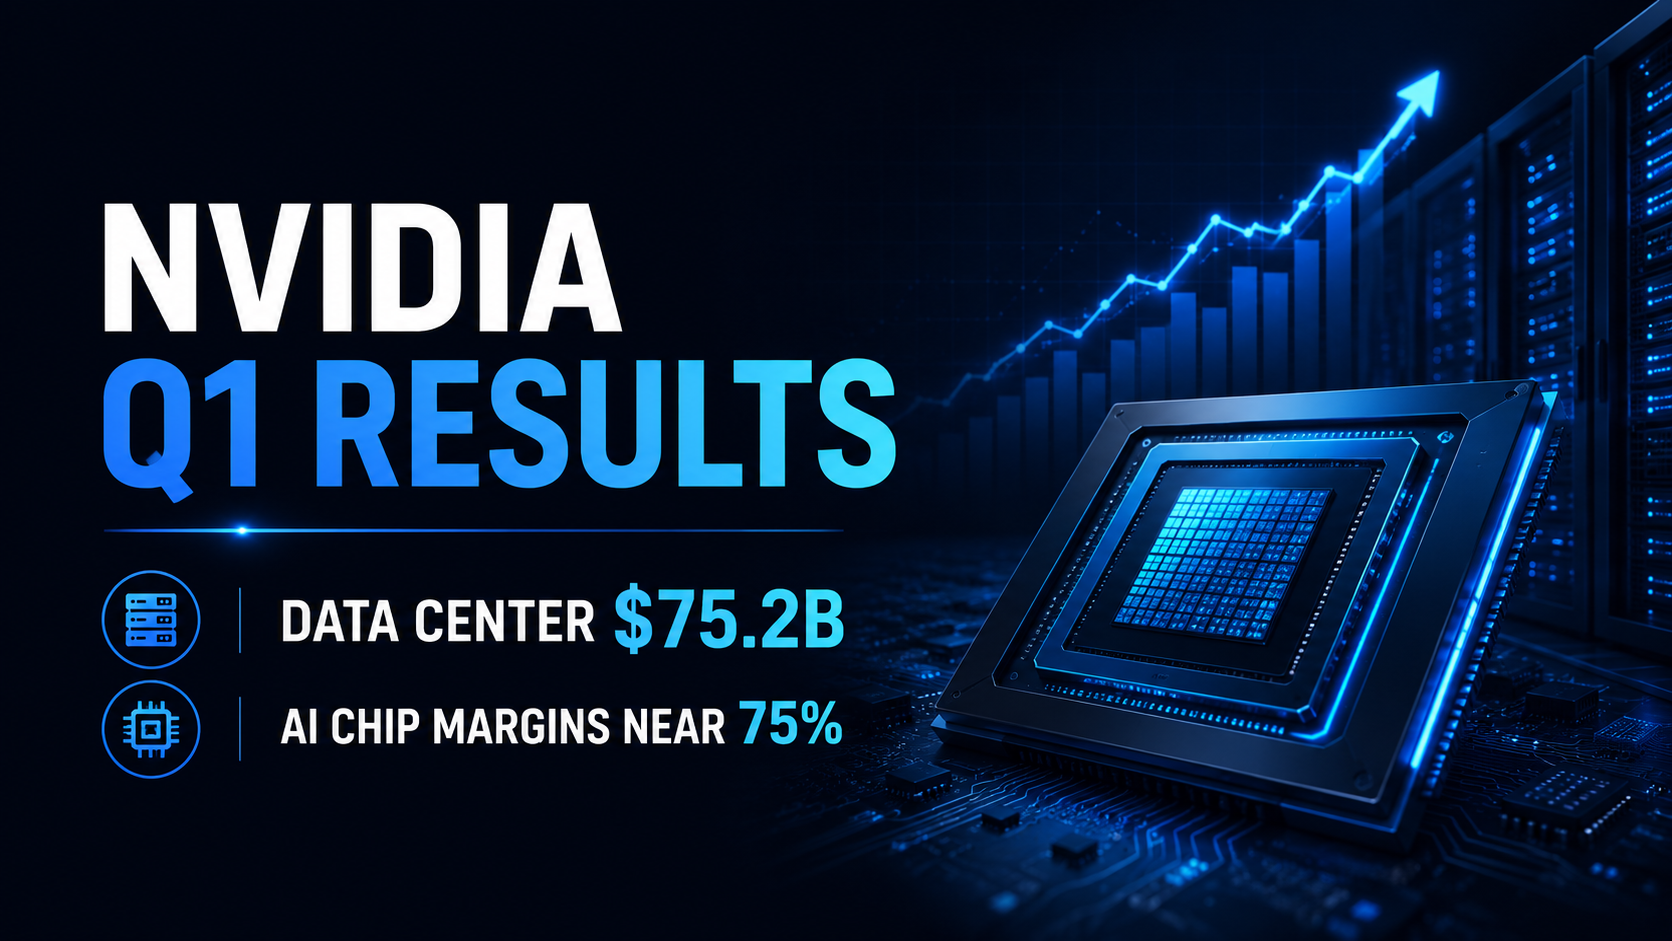
Обзор доходов Nvidia за Q1 FY2027: выручка дата-центров достигла $75,2 млрд, а маржа ИИ-чипов удерживается на уровне 75%

Обзор финансовых результатов Apple за 2 квартал 2026 финансового года: доходы от iPhone и рост сервисов поддерживают историю EPS


В тренде
Трендовые криптовалюты, которые в настоящее время привлекают значительное внимание рынка
Цены на криптовалюту
Криптовалюты с наибольшим объемом торгов
Недавно добавленные
Криптовалюты недавно внесенные в листинг и доступные для торговли