XRP price extended losses and traded below $2.120. The price is now attempting to start a fresh increase and faces hurdles near the $2.20 level. XRP price startedXRP price extended losses and traded below $2.120. The price is now attempting to start a fresh increase and faces hurdles near the $2.20 level. XRP price started

XRP Price Pushes for Gains, Resistance Keeps the Market Guessing

2026/01/09 12:08
3 min read
For feedback or concerns regarding this content, please contact us at crypto.news@mexc.com

XRP price extended losses and traded below $2.120. The price is now attempting to start a fresh increase and faces hurdles near the $2.20 level.

  • XRP price started a fresh decline below the $2.20 zone.
  • The price is now trading below $2.20 and the 100-hourly Simple Moving Average.
  • There was a break above a connecting bearish trend line with resistance at $2.10 on the hourly chart of the XRP/USD pair (data source from Kraken).
  • The pair could continue to move down if it stays below $2.20.

XRP Price Attempts Recovery

XRP price failed to stay above $2.25 and started a fresh decline, like Bitcoin and Ethereum. The price declined below $2.20 and $2.150 to enter a short-term bearish zone.

The price even spiked below $2.10. A low was formed at $2.063, and the price is now attempting to recover. There was a move above $2.120. Besides, there was a break above a connecting bearish trend line with resistance at $2.10 on the hourly chart of the XRP/USD pair.

It tested the 23.6% Fib retracement level of the downward move from the $2.416 swing high to the $2.063 low. The price is now trading below $2.20 and the 100-hourly Simple Moving Average.

If there is a fresh upward move, the price might face resistance near the $2.1680 level. The first major resistance is near the $2.20 level. A close above $2.20 could send the price to $2.240 or the 50% Fib retracement level of the downward move from the $2.416 swing high to the $2.063 low.

XRP Price

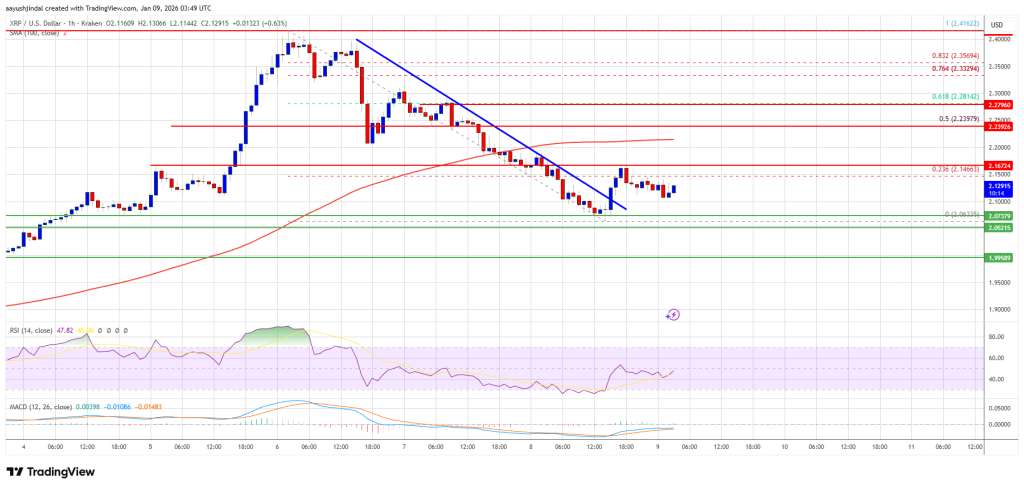
The next hurdle sits at $2.280. A clear move above the $2.280 resistance might send the price toward the $2.320 resistance. Any more gains might send the price toward the $2.350 resistance. The next major hurdle for the bulls might be near $2.40.

Another Decline?

If XRP fails to clear the $2.20 resistance zone, it could start a fresh decline. Initial support on the downside is near the $2.080 level. The next major support is near the $2.050 level.

If there is a downside break and a close below the $2.050 level, the price might continue to decline toward $2.00. The next major support sits near the $1.9650 zone, below which the price could continue lower toward $1.880.

Technical Indicators

Hourly MACD – The MACD for XRP/USD is now losing pace in the bearish zone.

Hourly RSI (Relative Strength Index) – The RSI for XRP/USD is now below the 50 level.

Major Support Levels – $2.080 and $2.050.

Major Resistance Levels – $2.1680 and $2.240.

Disclaimer: The articles reposted on this site are sourced from public platforms and are provided for informational purposes only. They do not necessarily reflect the views of MEXC. All rights remain with the original authors. If you believe any content infringes on third-party rights, please contact crypto.news@mexc.com for removal. MEXC makes no guarantees regarding the accuracy, completeness, or timeliness of the content and is not responsible for any actions taken based on the information provided. The content does not constitute financial, legal, or other professional advice, nor should it be considered a recommendation or endorsement by MEXC.

You May Also Like

SDNY October retrial date for Tornado Cash’s Storm draws Uniswap comparison

SDNY October retrial date for Tornado Cash’s Storm draws Uniswap comparison

The post SDNY October retrial date for Tornado Cash’s Storm draws Uniswap comparison appeared on BitcoinEthereumNews.com. Commentators in the crypto sector have
Share
BitcoinEthereumNews2026/03/11 00:39
Polymarket, Peter Thiel’s Palantir Eye ‘Surveillance Models’ for Sports Prediction Markets

Polymarket, Peter Thiel’s Palantir Eye ‘Surveillance Models’ for Sports Prediction Markets

The post Polymarket, Peter Thiel’s Palantir Eye ‘Surveillance Models’ for Sports Prediction Markets appeared on BitcoinEthereumNews.com. In brief Polymarket is
Share
BitcoinEthereumNews2026/03/11 00:23
Analyst Predicts ‘Uptober’ Rally for BTC Regardless of FOMC Decision

Analyst Predicts ‘Uptober’ Rally for BTC Regardless of FOMC Decision

The post Analyst Predicts ‘Uptober’ Rally for BTC Regardless of FOMC Decision appeared on BitcoinEthereumNews.com. Bitcoin traded at $116,236 as of 14:04 UTC on Sept. 17, up about 1% in the past 24 hours, holding above a key level as markets await the Federal Reserve’s policy announcement. Analysts’ comments Dean Crypto Trades noted on X that bitcoin is only about 7% above its post-election local peak, while the S&P 500 has risen 9% and gold has surged 36% during the same period. He said bitcoin has compressed more than those assets, making it likely to lead the next larger move, though it could form a “lower high” before extending further. He added that ether could join in once it breaks $5,000 and enters price discovery. Lark Davis pointed to bitcoin’s history around September FOMC meetings, saying every September decision since 2020 — except during the 2022 bear market — has preceded a strong rally. He stressed that the pattern is less about the Fed’s rate choice itself and more about seasonal dynamics, arguing that bitcoin tends to thrive in this period heading into “Uptober.” CoinDesk Research’s technical analysis According to CoinDesk Research’s technical analysis data model, bitcoin rose about 0.9% during the Sept. 16–17 analysis window, climbing from $115,461 to $116,520. BTC reached a session high of $117,317 at 07:00 UTC on Sept. 17 before consolidating. Following that peak, bitcoin tested the $116,400–$116,600 range multiple times, confirming it as a short-term support zone. In the final hour of the session, between 11:39 and 12:38 UTC, BTC attempted a breakout: prices moved narrowly between $116,351 and $116,376 before spiking to $116,551 at 12:34 on higher volume. This confirmed a consolidation-breakout pattern, though the gains were modest. Overall, bitcoin remains firm above $116,000, with support around $116,400 and resistance near $117,300. Latest 24-hour and one-month chart analysis The latest 24-hour CoinDesk Data chart, ending 14:04 UTC on…
Share
BitcoinEthereumNews2025/09/18 12:42