

XRP Price Prediction: Can Whale Accumulation and Network Activity Push It Above $1.30?
Key highlights:
- XRP is testing the key $1.30 resistance as technical and on-chain indicators continue to improve.
- Whale wallets now control 74.1% of the XRP supply after adding 1.53 billion coins over six months.
- Rising network activity and ETF inflows are supporting the XRP price recovery despite major resistance ahead.
XRP has found fresh strength after bouncing from its June lows, putting one of the market's biggest resistance levels back into focus. Trading between $1.24 and $1.29, XRP is now testing an area that could determine whether the recovery continues.
Crypto analyst CasiTrades pointed out that XRP is approaching the major $1.30 resistance after producing one of its strongest moves in months. The analyst also noted that the rebound from the $1.09 macro 0.786 Fibonacci support level has been much stronger than expected. Even so, the analyst maintains that a full bullish confirmation still requires XRP to reclaim and hold above $1.65.
XRP price is running into a major test
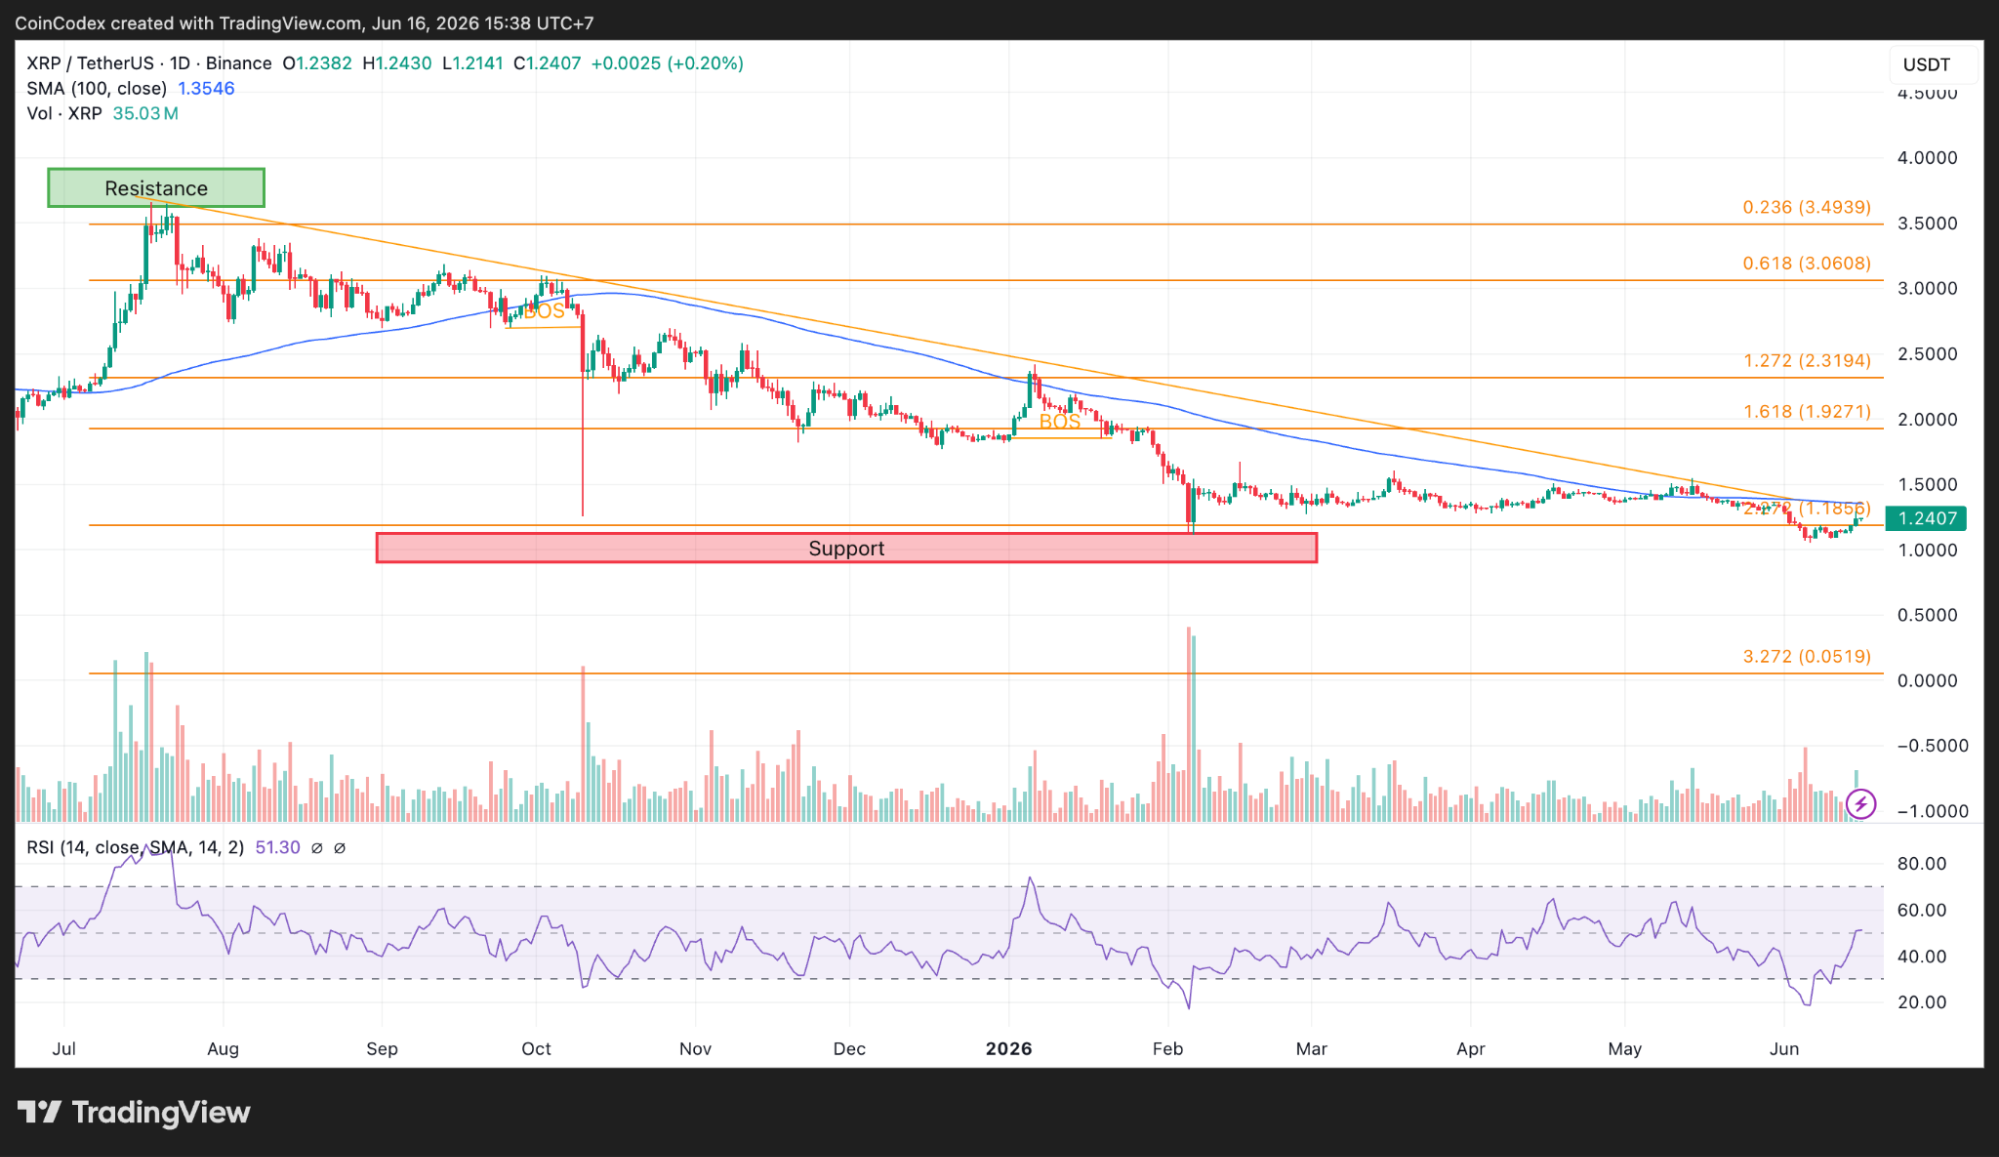
The XRP price has bounced strongly after remaining locked for months within a descending channel formed following its failure to reclaim the February/March peaks around $1.77-$1.80. The new move allowed XRP to touch the downtrend line and reclaim several Fibonacci levels which were previously broken.
The chart shared by Casi was analysed and the current technical condition of XRP has changed positively for bulls. The XRP price is now trading around $1.2869 following its breakout above the descending resistance line.
It should be noted that the powerful ascending trend line originating from the bottom of June around $0.85-$0.90 continues playing the role of support. The next significant level will be in the range between $1.5320 and $1.6371.
If the XRP price manages to clear that zone, attention could quickly turn back to the previous highs near $1.77-$1.80 and eventually the psychological $2.00 level. There is still a downside scenario to consider. If buyers fail to defend the breakout, support comes in around $1.20, followed by $1.05 and the broader demand zone between $0.90 and $1.00.
The XRP daily chart still has one big obstacle
The daily chart offers a slightly different perspective. XRP’s current price level stands at $1.24 with the daily Relative Strength Index being recorded at 51.30. This indicates that the market currently has a slight bias to buying momentum without crossing into the overbought region, as seen in the daily price chart.
Daily XRP chart analysis
The key technical resistance level will be found in the 100-day Simple Moving Average at $1.3546. XRP is below this technical level, thus representing one of the key technical levels.
The medium-term structure still indicates a bearish trend following the highs from 2025. The structure was broken unsuccessfully several times during this bearish trend, and the buyers managed to defend the main support area between $1.00 and $1.20.
Holding above that zone has allowed the XRP price to establish a stronger base. A daily close above $1.30 followed by a move through the SMA 100 would give traders much stronger evidence that the correction phase is ending.
Whale accumulation continues supporting the market
The on-chain picture is also improving. The data provided by Santiment shows that wallets with at least one million XRP currently own 74.10% of the total supply of XRP tokens. Within the last six months, these wallets have also purchased 1.53 billion more XRP tokens, which represents an increase of 0.39%.
What makes that data interesting is the timing. Large holders continued adding XRP during the correction instead of reducing exposure, even when price remained under pressure. That concentration also reduces the amount of XRP available for active trading.
There is another side to that concentration. If large holders decide to take profits, they could introduce heavy selling pressure. At the moment, though, the accumulation trend continues moving in the same direction as the XRP price recovery.
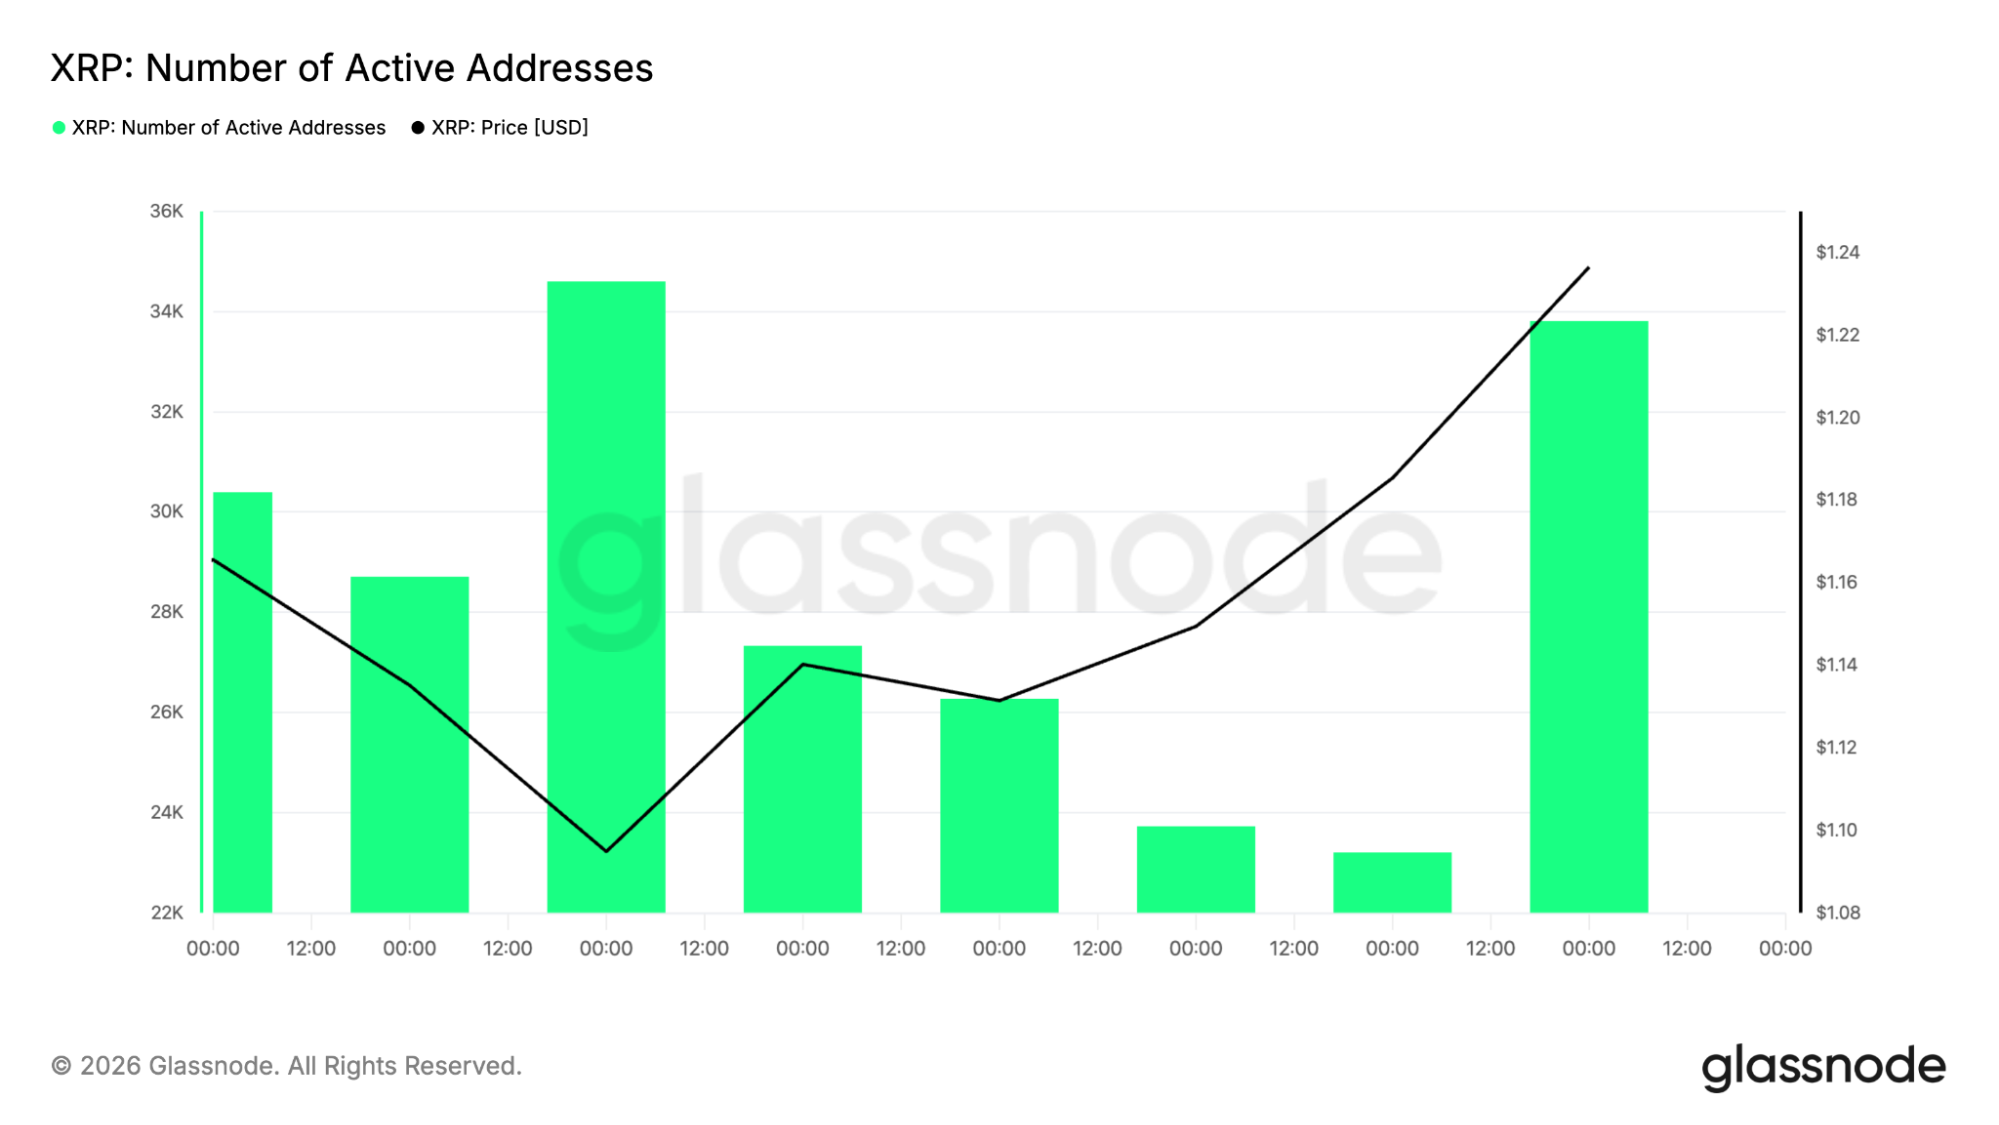
Network activity is climbing alongside price
User activity across the XRP Ledger is improving as well. The number of active addresses has made its way back from the bottom range of 23,500-26,500 to reach the 33,800-34,000 level. This rise has occurred in parallel with the price shift for XRP from about $1.09 to roughly $1.24.
Transfer activity shows a similar pattern. Daily transactions climbed from approximately 370,000-440,000 during the correction back toward 595,000 transfers as the market recovered.
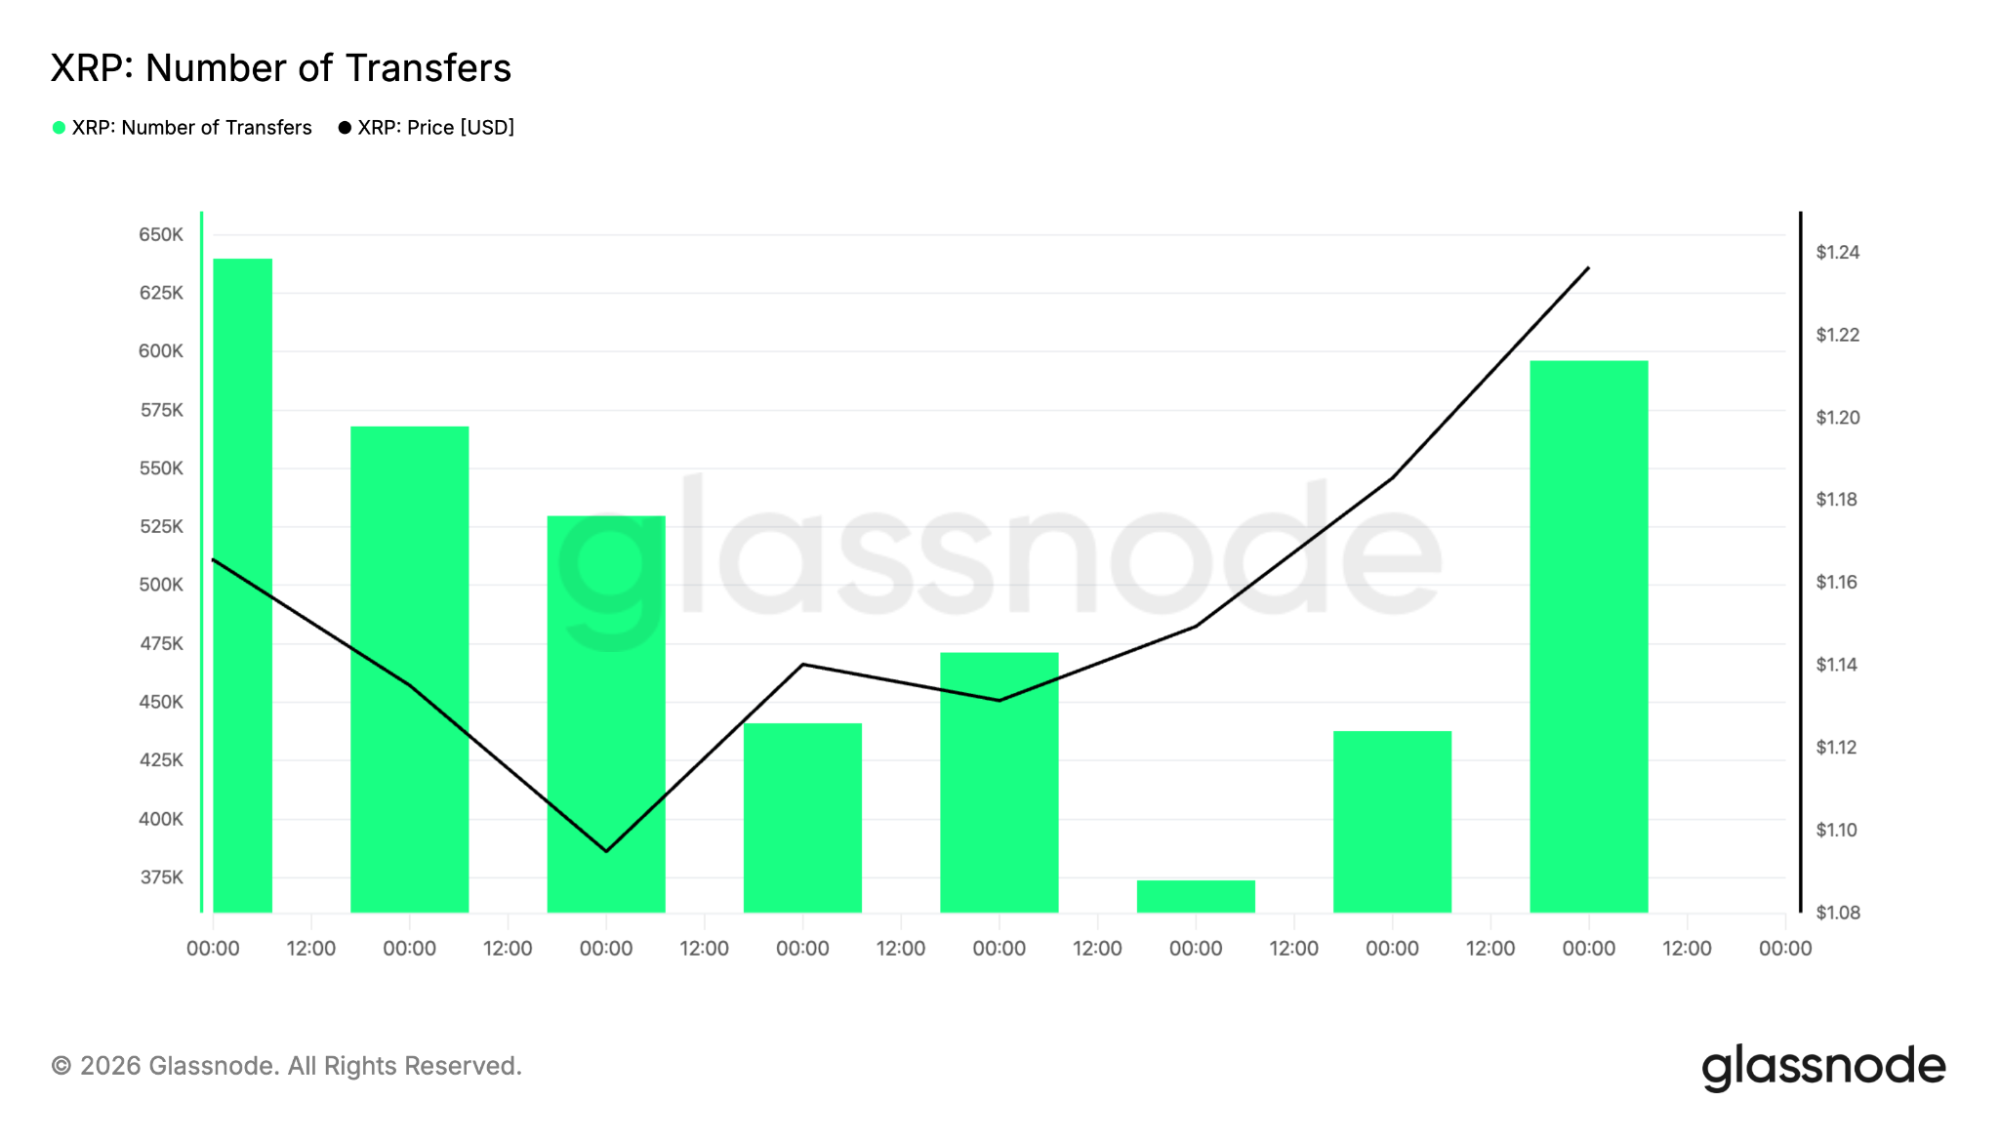
That combination points to expanding participation instead of a rally driven entirely by speculation. Daily active addresses between 30,000 and 50,000 remain typical for XRP throughout 2026, making the latest increase a healthy sign for the network.
XRP regulation, ETF demand and network development
The SEC lawsuit reached a settlement in 2025, confirming that XRP is not classified as a security when traded on public exchanges. That removed one of the biggest regulatory risks surrounding the asset and opened the door for seven spot XRP ETFs.
Institutional demand continues to appear through fund flows, with XRP ETFs attracting roughly $2.82 million in a single trading session even as Bitcoin ETFs recorded outflows. The technical aspect of the XRP Ledger is also progressing.
Version 3.2.0 came into effect on June 15, 2026, with improvements that lower server consumption by up to 40%. It should also be noted that developers announced the following roadmap, which includes enhanced privacy capabilities, DeFi loans functionality, and improved programmability.
Another factor that traders are paying attention to is involvement from exchanges. According to reports, a significant part of recent purchases was made by users of Upbit, representing about 31% of trading volume.
What comes next for the XRP price?
The XRP price is entering one of its most important technical zones of the year. A move above $1.30 would bring the 100-day SMA near $1.35 into focus before attention turns toward the Fibonacci resistance zone between $1.53 and $1.64. Breaking through those levels would increase the chances of a return toward $1.77 and possibly the $2.00 area.
Support remains clearly defined around $1.20, followed by $1.05 and the broader $0.90-$1.00 demand zone. Whale accumulation, rising network activity, stronger transfer volumes, ETF inflows and ongoing XRP Ledger upgrades all provide support for the recovery.
The next step is seeing whether buyers can turn the breakout into a sustained move by reclaiming the resistance levels that have capped XRP for months. According to CoinCodex’s 1-month XRP price prediction, the price could move toward $1.22, pointing to limited downside and a relatively stable trading range over the coming weeks.


You May Also Like
DCodex Officially Launches DPay, a Visa-Powered USDT Payment Card Bridging Crypto Assets and Real-World Spending

Western Digital Jumps 7% on Morgan Stanley’s 33% Price-Target Hike, Seagate Gains 5% as the AI Storage Boom Rolls On
'Why even bother?' Trump stuns after casually folding on 'his main justification' for war


