Ripple price today: will reclaim 1.42 or break to 1.35 amid thin alt risk?
With volatility compressed and structure tilted bearish, Ripple price today sits near 1.39 at the daily pivot below the 20/50-day EMAs around 1.42. Altcoin risk appetite is thin as Bitcoin dominance holds near 58% and the Fear & Greed Index prints 25.
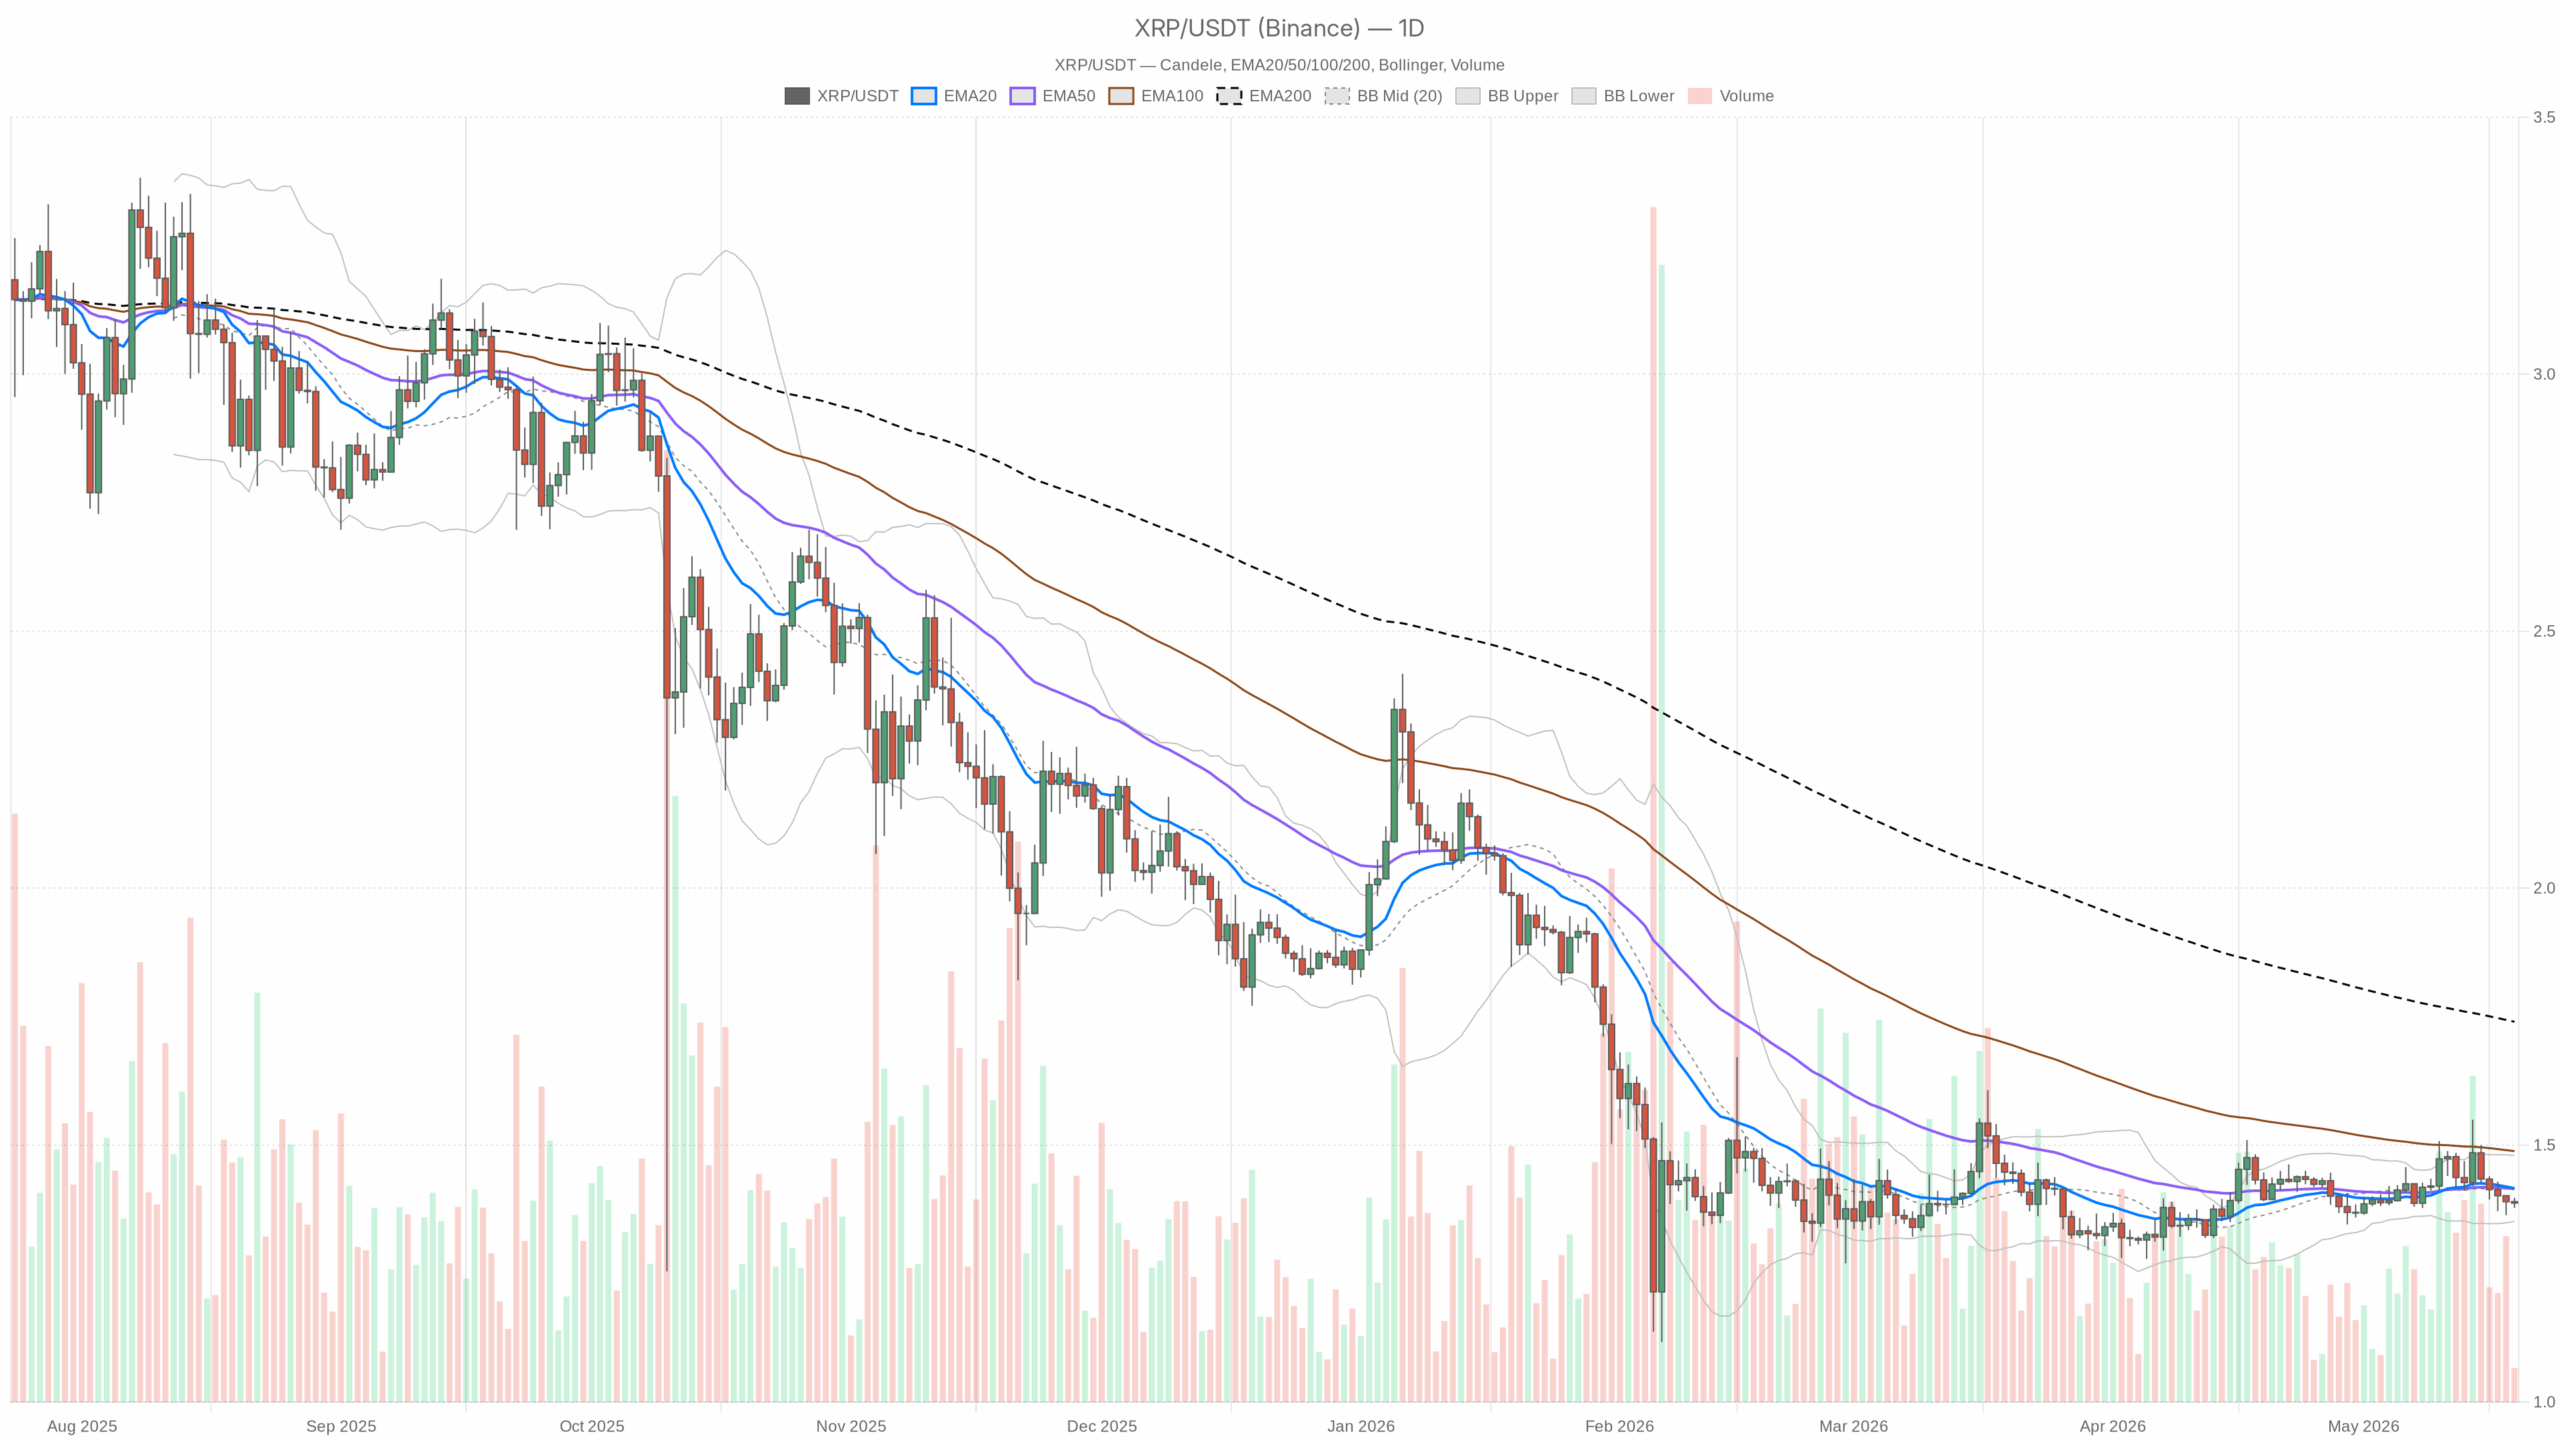 XRP/USDT — daily chart with candlesticks, EMA20/EMA50 and volume.
Thesis
Price sits at 1.39, pinned to the daily pivot while trading below the 20/50-day EMAs clustered at 1.42. That is a classic stalemate: structure says rallies get sold, yet realized volatility is tight, so breakouts need real fuel.
With Bitcoin dominance elevated (~58%) and the Fear & Greed Index in Extreme Fear (25) as of 19 May 2026, altcoin risk appetite is thin. Consequently, price is trapped between a hard ceiling (1.40–1.42) and a soft floor (1.38–1.35). Whichever side gives first likely sets the next leg.
Market logic
Daily trend vs. mean reversion: The macro (D1) is neutral-to-bearish under the EMAs, encouraging mean-reversion sells into 1.40–1.42. However, momentum is muted, and structure still favors sellers until 1.42 is reclaimed. Moreover, extreme fear and high BTC dominance argue for defensive positioning, so alt rallies can stall quicker than usual.
Multi-timeframe read
Daily (macro bias): Neutral regime but below the 20/50/200 EMAs. Range is 1.35–1.48 with the midline at 1.42. That said, the bias stays capped while price lives under that midline/EMA cluster.
1H (confirmation): Flat to neutral. Price hugs the 1H EMA20 around 1.39 and fades into 1.40/1.40s. However, no clear impulse is present; intraday traders are fading edges inside a 1.38–1.40 box.
Meanwhile, 15m (execution): Micro up-tilt but inside a very tight coil. It is an execution timeframe only; look for expansion out of 1.38–1.40 before committing size.
Indicator evidence (with quick interpretations)
Daily (D1)
- EMA20/EMA50: 1.42 / 1.42; EMA200: 1.74 — Price (1.39) sits below all key EMAs, so the burden of proof is on buyers; 1.42 is the immediate battleground.
- RSI14: 45.13 — Sub-50 momentum; sellers have a slight edge, but no exhaustion extremes.
- MACD: line 0 vs signal 0.01, hist -0.01 — Flat to slightly negative; momentum is indecisive and easily swayed by news/flows.
- Bollinger Bands: mid 1.42, upper 1.48, lower 1.35 — Price sits below the midline; it is a range with room to probe 1.35 unless 1.42 is reclaimed.
- ATR14: 0.06 — Compressed daily volatility; breakouts need a catalyst and can travel quickly once released.
- Pivots: PP 1.39, R1 1.40, S1 1.38 — We are parked at the pivot; expect whips if 1.38–1.40 keeps absorbing.
1H
- EMA20/EMA50/EMA200: 1.39 / 1.40 / 1.42 — Price is riding the 20 EMA, but the 50/200 overhead form a lid; the 1.40–1.42 supply zone remains intact.
- RSI14: 49.09 — Neutral; intraday momentum is balanced and reactive to levels.
- MACD: line ~0, signal ~0, hist ~0 — No impulse; range tactics dominate.
- Bollinger Bands: mid 1.38, upper 1.40, lower 1.37 — Price near the upper band; small intraday bids, but resistance kicks in at 1.40.
- ATR14: 0.01 — Very tight intraday ranges; expect fake breaks unless multiple candles hold beyond levels.
- Pivots: PP 1.39, R1 1.39, S1 1.38 — Micro-balance; first move through 1.38 or 1.40 likely runs stops.
15m
- EMA20/EMA50/EMA200: all ~1.39 — Perfect coil; energy is building, direction not yet chosen.
- RSI14: 53.36 — Slight bid, but nothing sustained without a level break.
- MACD: flat — Micro drift; algos in charge until expansion.
- Bollinger Bands: mid 1.38, upper 1.39, lower 1.38 — Riding the top of a narrow band; upside attempts fade near 1.40.
- ATR14: ~0 — Ultra-compressed; expect an expansion move.
- Pivots: PP/R1/S1 all ~1.39 — Noise zone; wait for the higher-timeframe trigger.
Main scenario (based on D1): Neutral
Still, below the daily 20/50 EMAs with sub-50 RSI, Ripple price today remains range-bound with a bearish lean. Until 1.42 is reclaimed on a daily closing basis, rallies are vulnerable to fade.
Clear paths
Bullish scenario: A clean break and daily close above 1.42 (EMA20/50 and BB mid) converts resistance into a platform. Intraday, look for 1H acceptance above 1.40 with RSI >55 to front-run the daily close. If confirmed, upside targets are 1.45 first and the BB upper band near 1.48 next. Invalidation: a drop back below 1.39 after the breakout, or a daily close back under 1.40, would signal a failed reclaim.
Bearish scenario: Rejection between 1.40–1.42 keeps the range heavy and opens a retest of 1.38 then 1.35 (BB lower). A decisive daily close below 1.35 would hand bears control, with an ATR extension pointing toward the 1.29–1.31 area. Invalidation: a daily close above 1.42 neutralizes the downside and flips the bias.
Positioning, risk, volatility
Additionally, this is a patience trade. Let price choose between 1.38 and 1.42. In a market running on extreme fear and high BTC dominance, demand for alt exposure is selective, and breakouts need confirmation across timeframes. Expect headline sensitivity: with ATR compressed, any catalyst can produce outsized moves relative to recent days. Position sizing should respect potential expansions, and partials make sense near band edges.
In sum, the setup is a tight range under resistance, with volatility suppressed and sentiment cautious. A decisive move through 1.42 or 1.38 will likely define the next leg, so confirmation across timeframes remains essential.


You May Also Like

Cathie Wood’s ARK Invest Buys $13.7M in Circle Shares While Selling Robinhood Stock

Metaplanet buys 5,075 Bitcoin in Q1 to become 3rd-largest treasury

The changing face of elder care in Malaysia — Sayed Mohammad Reza Yamani Sayed Umar