Ripple Price Under Pressure: Is XRP Nearing Exhaustion or Just Getting Started?

Market pressure is intensifying as the Ripple price grinds lower while broader crypto sentiment remains locked in Extreme Fear.
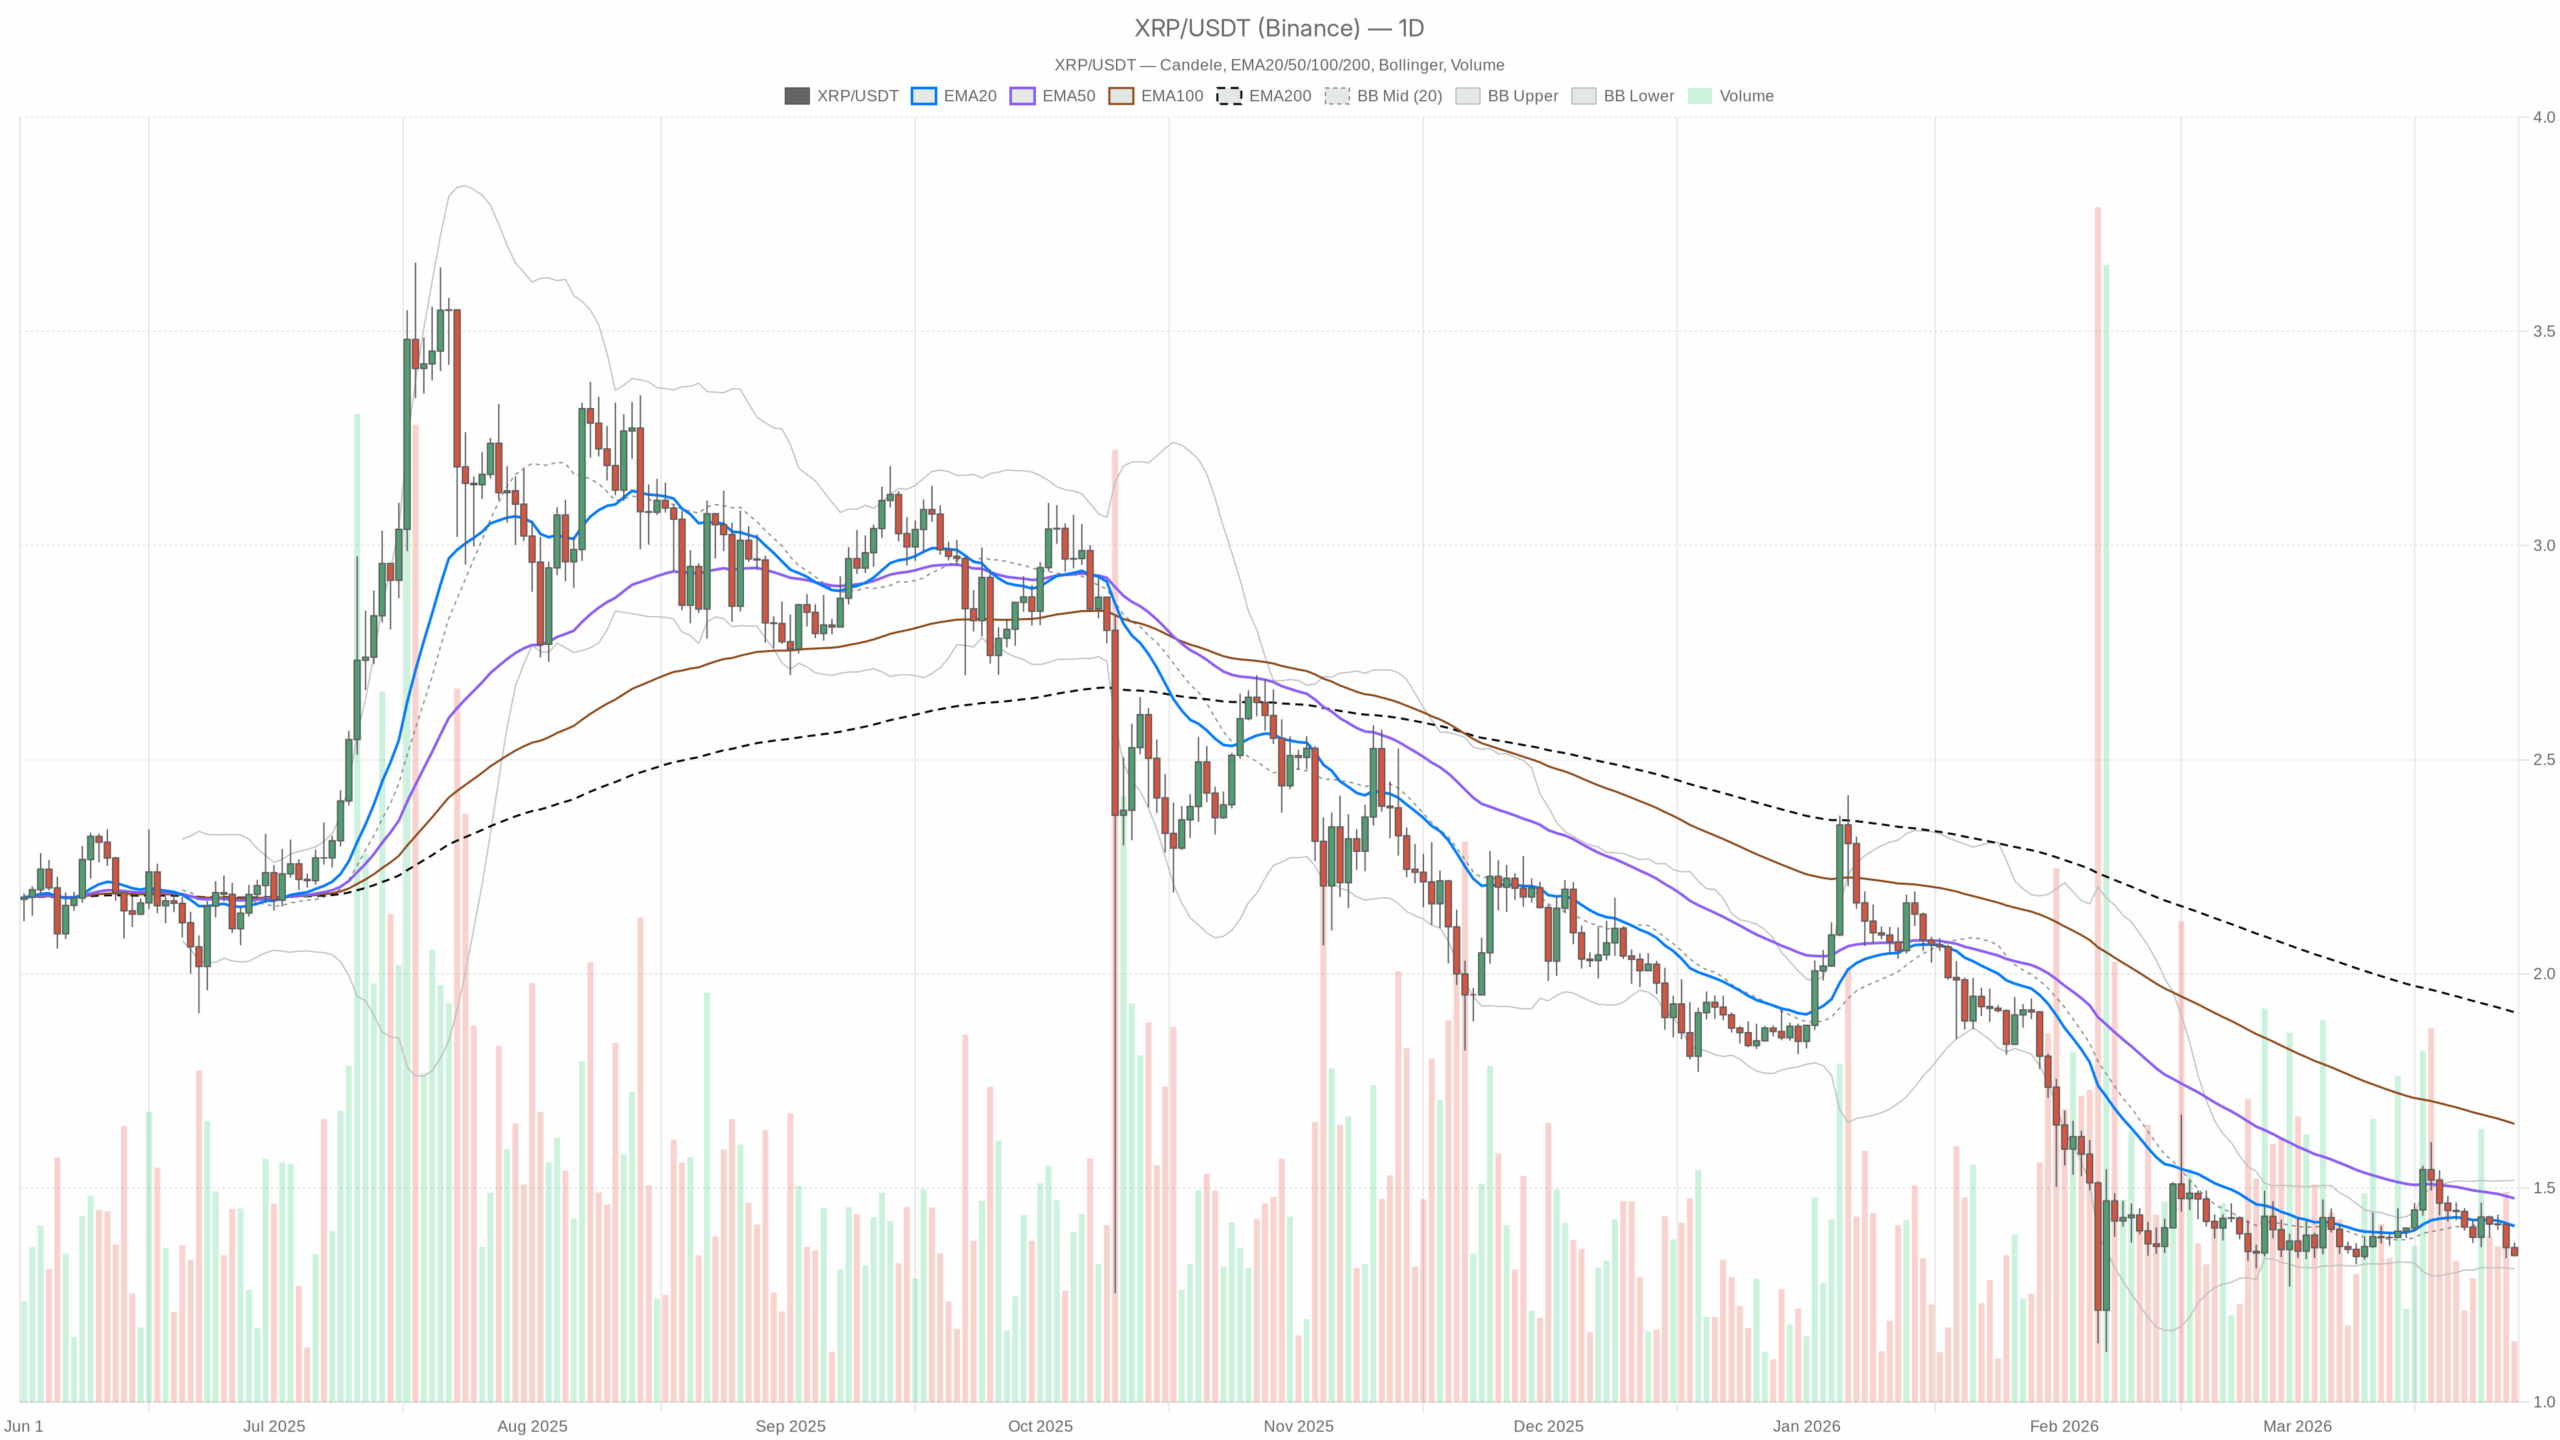 XRP/USDT daily chart with EMA20, EMA50 and volume”
loading=”lazy” />XRP/USDT — daily chart with candlesticks, EMA20/EMA50 and volume.
Daily Chart (D1): Main Scenario and Structure
The daily timeframe defines the primary bias, and here the message is clear: main scenario is bearish.
Trend and EMAs (Daily)
- Price (close): $1.34
- EMA 20: $1.41
- EMA 50: $1.48
- EMA 200: $1.91
- Regime: bearish
XRP is trading below the 20, 50, and 200-day EMAs, with each EMA stacked above the next (20 < 50 < 200 in price terms). That is a textbook bearish alignment and shows the downtrend is established, not a one-day shock. For bulls, the first serious sign of life would be a reclaim of the 20-day EMA around $1.41; until then, every bounce is technically a rally into resistance.
RSI 14 (Daily)
- RSI 14: 40.08
Daily RSI sitting just above 40 keeps XRP in a weak but not yet washed-out zone. It is below the midpoint, so momentum favors sellers, but it is not deep oversold. That means there is still room for another leg down before the market hits true capitulation levels. In other words, bears are in control, but the move is not so stretched that a violent mean reversion is mandatory yet.
MACD (Daily)
- MACD line: -0.01
- Signal line: -0.01
- Histogram: -0.01
Daily MACD is slightly negative and nearly flat. That points to a downtrend that is losing momentum rather than accelerating. Sellers are still ahead, but without strong follow-through. This kind of MACD profile often appears either before a grindy continuation leg lower or ahead of a basing phase. It is not a clean reversal signal, but it does suggest the most aggressive selling may already be behind us in the short term.
Bollinger Bands & Volatility (Daily)
- BB mid (20 SMA proxy): $1.41
- Upper band: $1.52
- Lower band: $1.31
- ATR 14: $0.07
Price is hovering just above the lower daily Bollinger Band at $1.31, while the close is $1.34. That shows XRP has been pressing into the lower volatility envelope, a sign of persistent selling pressure. However, because price is not hugging the band aggressively and ATR is fairly modest at $0.07, the move looks more like a controlled drift lower than a panic flush. This favors trend continuity with occasional bounces rather than a single capitulation wick, for now.
Daily Pivot Levels
- Pivot point (PP): $1.35
- Resistance 1 (R1): $1.36
- Support 1 (S1): $1.33
The daily pivot is almost exactly where price is trading, which means the market is undecided intraday within a broader downtrend. Immediate support is clustered around $1.33, with resistance starting already at $1.36. That is a very tight range, consistent with low daily ATR, and it often precedes a volatility expansion. A firm break below $1.33 would open the door to a deeper slide, while a reclaim and hold above $1.36 would hint that short-term sellers are backing off.
1-Hour Chart (H1): Short-Term Momentum
The hourly chart backs up the bearish daily bias but adds an important nuance: short-term selling looks stretched.
Trend and EMAs (H1)
- Price (close): $1.34
- EMA 20: $1.36
- EMA 50: $1.38
- EMA 200: $1.41
- Regime: bearish
On the 1-hour, price is again below all key EMAs, and each EMA slopes down. That is intraday confirmation of the downtrend. What matters is the gap: from $1.34 up to the 20 EMA at $1.36 is not huge, but enough that any short-covering rally could quickly retest that level. The 200 EMA at $1.41 aligns with the daily 20 EMA, creating a strong confluence area where any bounce is likely to face heavy supply.
RSI 14 (H1)
- RSI 14: 28.93
Hourly RSI is pushed into oversold territory below 30. That shows the short-term leg is stretched and vulnerable to at least a relief bounce, even if the bigger trend stays down. Sellers have been pressing hard in the last several hours; consequently, chasing fresh shorts down here on the 1-hour chart is late from a tactical standpoint.
MACD (H1)
- MACD line: -0.01
- Signal line: -0.01
- Histogram: 0.00
MACD on the hourly is negative but the histogram is around zero, hinting at a potential momentum stall. Selling has dominated, but the incremental push is fading. Combined with the oversold RSI, this supports the idea of a near-term pause or bounce rather than an uninterrupted waterfall.
Bollinger Bands & ATR (H1)
- BB mid: $1.36
- Upper band: $1.37
- Lower band: $1.34
- ATR 14: $0.01
On the hourly, price is basically sitting on the lower Bollinger Band at $1.34, with a narrow band width and ATR at only $0.01. That is classic compression near the lows. Market participants are selling, but without big candles or spikes, so think grind, not crash. This sort of setup can resolve in one of two ways: a slow bleed lower as the band walks down, or a snapback towards the mid-band around $1.36 if shorts get crowded.
Hourly Pivot Levels
- Pivot point (PP): $1.34
- Resistance 1 (R1): $1.35
- Support 1 (S1): $1.34
The hourly pivot structure is extremely tight, with support and pivot effectively at the same level ($1.34). That confirms the market is in a micro-balance area intraday. A push through $1.35 would be the first sign of a small squeeze, while losing $1.34 with momentum would signal that sellers have more work to do below.
15-Minute Chart (M15): Execution Context
The 15-minute chart does not change the story, but it refines the entry and exit context: short-term oversold within a broader downtrend.
Trend and EMAs (M15)
- Price (close): $1.34
- EMA 20: $1.36
- EMA 50: $1.36
- EMA 200: $1.38
- Regime: bearish
On M15, price is clearly below the 20, 50, and 200 EMAs, all of which sit above at $1.36–1.38. That confirms the local downtrend. For intraday traders, any rally into the 20–50 EMA zone near $1.36 is a logical battleground where either sellers reassert control or a more meaningful squeeze begins.
RSI 14 (M15)
- RSI 14: 29.54
RSI on the 15-minute is also oversold, echoing the hourly signal. This alignment across lower timeframes reinforces the idea that the move down is currently stretched intraday. Short-term traders selling here are pressing into a crowded side of the market, which often leads to choppy price action or quick, sharp bounces.
MACD (M15)
- MACD line: 0.00
- Signal line: 0.00
- Histogram: 0.00
MACD on M15 is essentially flat, reflecting micro-timeframe indecision right at the lows. There is no clear bullish or bearish momentum signal here. It is more about consolidation after the push down than about fresh trend information.
Bollinger Bands & ATR (M15)
- BB mid: $1.36
- Upper band: $1.37
- Lower band: $1.35
- ATR 14: ≈ $0.00 (very low)
Bands are tight with almost no recorded ATR, indicating very low intraday volatility on this timeframe. Price is sitting below the mid-band and near the lower band, consistent with a slow grind lower. Low volatility at the tail end of a sell-off often precedes either a continuation drip lower or a quick volatility spike when one side finally gives up.
Bullish Scenario for Ripple Price
Despite the clear bearish backdrop, the lower timeframes and sentiment backdrop create a path for a counter-trend bounce if certain levels are reclaimed.
What Bulls Want to See
The constructive path for XRP from here would look something like this.
First, on the intraday side, buyers would need to defend the $1.33–1.34 support cluster, which is the daily S1 and current price area. Holding above this zone while hourly and 15-minute RSI work their way out of oversold would lay the groundwork for a bounce. A move back above $1.35–1.36, near the H1 R1 and daily R1 or pivot region, would show that short-term sellers are losing control.
From there, the real test for any sustainable bullish attempt is the confluence of $1.40–1.41, where the H1 200 EMA and the daily 20 EMA align with the daily Bollinger mid. If XRP can push into that zone and actually close daily candles above $1.41, the narrative shifts from dead-cat bounce to possible base building.
On the indicator side, the bullish scenario would involve:
- Daily RSI climbing back above 50, flipping momentum from defensive to neutral-to-positive.
- Daily MACD histogram moving towards zero and ideally turning positive, signaling a real shift in momentum rather than just short covering.
- Price moving from pressing the lower Bollinger Band up towards the mid-band and starting to trade in the upper half of the band structure.
If those conditions line up, the door opens for a larger move toward the daily EMA 50 around $1.48. That would still be a move inside a longer-term bearish structure, but meaningful enough for swing traders.
Bullish Invalidation
The bullish counter-trend idea breaks if XRP loses $1.33 with conviction and daily candles start closing well below the lower Bollinger Band around $1.31. In that case, the market is not in a basing phase; it is in an acceleration lower. A further drop in daily RSI towards the low 30s without any strong bounce would confirm that bulls have lost the immediate window for a relief rally.
Bearish Scenario for Ripple Price
The higher-probability backdrop right now remains downside continuation, given the multi-timeframe trend alignment and the macro risk-off tone.
How the Downtrend Extends
For bears, the ideal path is simple: convert $1.34–1.35 into a firm ceiling. If each intraday bounce into that area is sold and hourly EMAs continue to push lower, the oversold RSI readings can work off through sideways-to-down drift instead of a sharp bounce. That is the classic bleed behavior you often see during strong risk-off phases.
On the daily, staying locked below the 20 EMA at $1.41 keeps the bias firmly negative. Persistent closes near or below the lower Bollinger Band at $1.31 would reflect ongoing distribution. If daily ATR starts to expand from $0.07 while price breaks under $1.31, that would flag an acceleration phase, with the market shifting from controlled selling to more emotional moves.
Indicators backing a continued bearish case would include:
- Daily RSI slipping from around 40 towards 30, signaling increasing downside momentum.
- Daily MACD line moving further negative and the histogram deepening, showing renewed selling strength.
- Bollinger Bands widening with price walking the band lower, a sign that volatility is expanding in favor of the trend.
All this occurs against a macro tape where BTC dominance is rising and total market cap is contracting. In such phases, alts like XRP often underperform because capital rotates into the relative safety of majors or stablecoins.
Bearish Invalidation
The bearish continuation narrative weakens if XRP can reclaim and hold above $1.41 on a daily closing basis. That level is the key pivot where multiple EMAs and the Bollinger mid-line converge. Above it, there is no longer clean, one-sided moving average alignment, and short positions become more crowded and vulnerable to squeezes.
Additionally, if daily RSI can sustain above 50 and MACD crosses back toward positive with an improving histogram, it would signal that the downtrend is at least pausing, if not ending. In that case, the setup shifts from a simple downtrend to a potential range or even early-stage uptrend, and bears need to reassess aggressively.
Positioning, Risk, and Uncertainty
From a positioning standpoint, the message is straightforward: trend is down, but short-term momentum is stretched. The daily chart shows the risk of further downside in the Ripple price, especially with the broader crypto market in defense mode and sentiment locked in Extreme Fear. At the same time, both the 1-hour and 15-minute charts flash oversold, which historically is where late shorts often get punished by sudden, sharp bounces.
This is a classic environment where timeframe discipline matters more than ever. Traders operating on the daily chart will see a clean bearish trend and likely treat bounces as opportunities to fade. Intraday traders, on the other hand, have to respect the risk of whipsaws in a tight range around $1.33–1.36 while volatility is compressed.
Volatility is currently modest but coiled. ATR on the lower timeframes is tiny, and price is stuck near the lower bands. That combination rarely lasts. Once XRP breaks out of this micro-range, either below $1.33 or above $1.36–1.40, volatility is likely to pick up and moves may extend more than recent candles imply.
In summary, the dominant force is still bearish trend and macro risk-off, but the immediate tape is fragile and susceptible to snapbacks. Anyone engaging with the Ripple price here needs to anchor their view to a clear timeframe and respect that extremes in fear and oversold conditions often create sharp, asymmetric swings in both directions.


You May Also Like

Top 3 Meme Coins To Watch Now, With One New Token Leading the 15,000% Growth Narrative

Top Cardano (ADA) Price Predictions as of Late: 10x Explosion on the Way?