

Bitcoin Macro Bottom Not Confirmed Yet, Says Crypto Analyst
Bitcoin is trading around $66,000 at the time of writing, down 3% in the past 24h, as discussion grows around whether a macro bottom has actually formed.
The debate follows commentary from EGRAG CRYPTO, who argues that historical structure suggests the bottom is not yet confirmed.
While price has rebounded from recent lows, short-term stabilization alone does not necessarily equate to macro confirmation under his moving average framework.
Short-Term Price Structure (2H Chart)
On the 2-hour timeframe, Bitcoin is currently positioned just above an important short-term support band between $65,600 and $65,800. This zone represents the most recent local defense following the bounce from the $63,000–$63,200 swing low. That low marked the sharpest liquidation move in the current range and produced a reactive rally toward the upper boundary near $69,000.
The immediate technical risk lies in whether $65,600 holds. A sustained break below this level would expose $64,800 as the next downside reference, with the broader liquidity pocket remaining near $63,000. That lower zone is significant because it previously triggered aggressive buying interest.
On the upside, the first barrier remains near $67,200, which has acted as a short-term pivot during recent rotations. Beyond that, the $68,800–$69,200 area represents range resistance. Acceptance above this band would shift the near-term structure from compression to expansion.
Volume expanded meaningfully near the $63K low, indicating responsive demand, but upside continuation has so far lacked strong follow-through.
The Moving Average Framework Behind the Debate
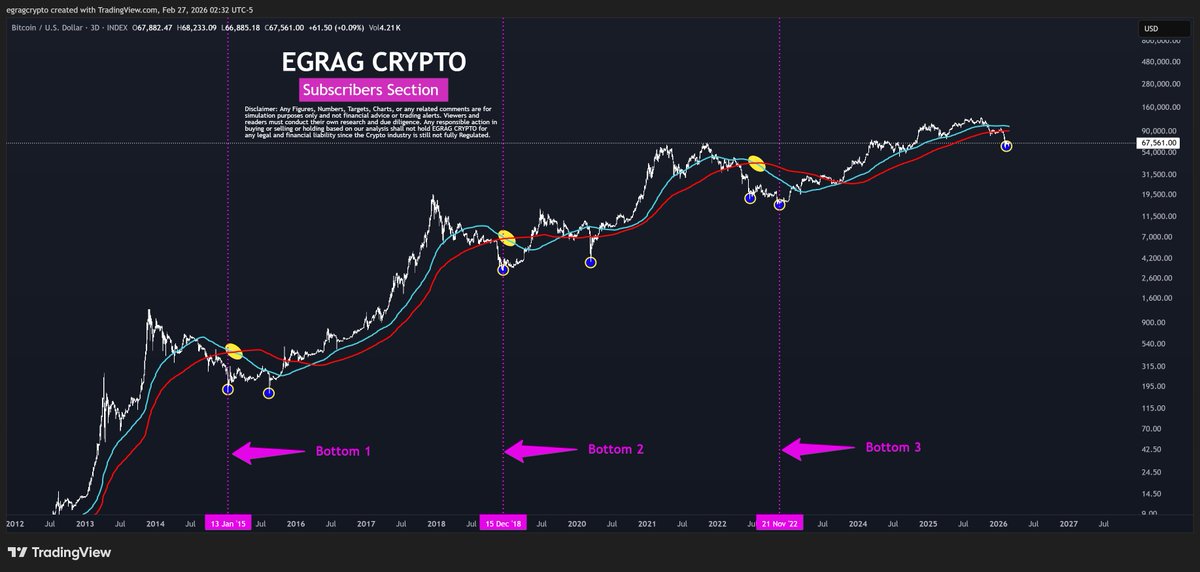
The macro argument referenced by EGRAG is based on a higher-timeframe chart that overlays two moving averages: a shorter-term light blue line and a longer-term red line.
 Source: https://x.com/egragcrypto/status/2027288982732620252
In the prior three major Bitcoin cycles, 2015, 2018, and 2022, the macro bottom formed either shortly before or shortly after the light blue moving average crossed below the red moving average. In each case, sustained expansion followed that bearish cross event. According to the historical pattern presented, no durable multi-year rally began without that structural sequence first occurring.
At present, that bearish cross has not taken place on the referenced timeframe. Under this framework, the absence of that cross implies that the macro bottom cannot yet be confirmed.
Short-Term Recovery vs. Macro Confirmation
The current price structure highlights a divergence in timeframe interpretation. On the 2-hour chart, Bitcoin is consolidating within a defined range between $63,000 and $69,000. From a trading perspective, this resembles standard range rotation following a volatility event.
However, from a macro perspective, the structural signal that accompanied previous cycle lows has not yet appeared. The debate therefore centers on whether this cycle deviates from historical precedent or is simply progressing through its typical structural sequence.
What Would Shift the Structure
If Bitcoin continues to defend the $65,600–$65,800 zone and reclaims $67,200, the short-term bias would tilt toward another test of the $69,000 range high. Acceptance above $69,200 would indicate renewed momentum and reduce the probability of immediate downside retests.
Conversely, a breakdown below $65,600 would increase the likelihood of revisiting $64,800, with a deeper move toward $63,000 reopening the broader downside structure. A decisive loss of $63,000 would weaken the current recovery thesis significantly.
The Bottom Line
At $66,000, Bitcoin is holding key short-term support but remains within a broader range. The macro moving average cross referenced in the debate has not occurred, meaning structural confirmation, under that specific historical model, is absent.
Whether this cycle follows prior patterns or delivers a deviation will determine how the current range resolves. For now, price is stabilizing, but confirmation requires either sustained acceptance above resistance or a deeper structural reset below support.
The post Bitcoin Macro Bottom Not Confirmed Yet, Says Crypto Analyst appeared first on ETHNews.


You May Also Like

Top U.S. economist says Gold reversal is imminent

Chainlink Whale Activity Rises While Price Bleeds for 7 Straight Months


