The Graph Price Prediction 2026-2030: Unveiling the Critical Path for GRT’s Future Value
BitcoinWorld
The Graph Price Prediction 2026-2030: Unveiling the Critical Path for GRT’s Future Value
As blockchain technology matures into its second decade, The Graph (GRT) protocol emerges as critical infrastructure for organizing and querying decentralized data. This analysis examines GRT price predictions from 2026 through 2030, considering technical indicators, adoption metrics, and broader Web3 ecosystem developments that will determine the token’s trajectory. The Graph’s fundamental role in making blockchain data accessible positions it uniquely within the cryptocurrency landscape, though its price movement depends on multiple interconnected factors.
The Graph Protocol: Foundational Web3 Infrastructure
The Graph protocol serves as the indexing layer for blockchain data, enabling developers to efficiently query information from networks like Ethereum, Polygon, and Arbitrum. Since its mainnet launch in December 2020, The Graph has processed over one trillion queries across more than 40 different blockchain networks. This infrastructure supports thousands of decentralized applications including Uniswap, Aave, and Decentraland. The protocol’s utility stems from its ability to transform raw blockchain data into organized, queryable information through subgraphs—open APIs that anyone can build and publish.
Network activity provides crucial context for price analysis. During 2023-2024, The Graph witnessed consistent growth in query volume despite broader market volatility. The protocol currently indexes data from 40+ blockchain networks with over 700 active subgraphs. Furthermore, the decentralized network includes approximately 200 Indexers, 8,000+ Delegators, and 100,000+ Curators participating in the ecosystem. These metrics demonstrate real utility beyond speculative trading.
Technical Architecture and Token Utility
The GRT token serves three primary functions within The Graph ecosystem. First, Indexers stake GRT to provide indexing and query processing services, earning query fees and indexing rewards. Second, Curators signal on subgraphs using GRT to indicate high-quality data sources, earning a portion of query fees. Third, Delegators stake GRT with Indexers without running nodes themselves, participating in network security and earning rewards. This economic model creates continuous demand for GRT from network participants seeking to earn protocol rewards.
Historical Price Analysis and Market Context
GRT launched publicly in December 2020 with an initial price of approximately $0.12. The token reached its all-time high of $2.88 in February 2021 during the broader cryptocurrency bull market. Subsequently, GRT experienced the market-wide correction of 2022, declining to approximately $0.09 by November 2022. Throughout 2023-2024, GRT demonstrated resilience, trading within a $0.08-$0.25 range while establishing stronger fundamentals through increased protocol usage.
Several key events influenced GRT’s historical price action. The protocol’s mainnet launch in December 2020 established initial utility. The migration to Arbitrum in 2023 significantly reduced gas costs for network participants. Additionally, partnerships with major blockchain projects including Polygon, Optimism, and Avalanche expanded The Graph’s addressable market. These developments created fundamental value independent of speculative trading activity.
| Date | Event | Price Impact |
|---|---|---|
| Dec 2020 | Mainnet Launch | Initial price discovery |
| Feb 2021 | All-time High | $2.88 peak |
| Nov 2022 | Market Bottom | $0.09 low |
| Jun 2023 | Arbitrum Migration | +35% monthly gain |
| Mar 2024 | Multi-chain Expansion | Sustained above $0.15 |
Methodology for GRT Price Predictions 2026-2030
Price predictions incorporate multiple analytical frameworks rather than relying on single methodologies. Technical analysis examines historical patterns, support/resistance levels, and moving averages. Fundamental analysis evaluates protocol metrics including query volume, subgraph growth, and network participation. Comparative analysis benchmarks GRT against similar infrastructure tokens. Finally, macroeconomic factors consider broader cryptocurrency adoption trends and regulatory developments.
Analysts emphasize several critical variables for GRT’s future price trajectory. Web3 adoption rates directly impact query demand. Protocol upgrades and feature developments enhance utility. Competitive landscape evolution affects market positioning. Broader cryptocurrency market cycles create contextual price movements. Token emission schedules and inflation rates influence supply dynamics. These interconnected factors require continuous monitoring rather than static predictions.
Expert Consensus and Analytical Approaches
Industry analysts employ diverse methodologies for GRT price predictions. Quantitative models incorporate on-chain metrics and network growth rates. Qualitative assessments evaluate protocol development and partnership announcements. Sentiment analysis tracks developer and institutional interest. Historical pattern recognition identifies cyclical behaviors. Most experts emphasize ranges rather than precise numbers, acknowledging cryptocurrency market volatility and unpredictable external events.
GRT Price Prediction 2026: Consolidation and Growth Phase
By 2026, The Graph protocol will likely have solidified its position as the dominant blockchain indexing solution. Assuming continued Web3 adoption, GRT could trade within a range of $0.45 to $1.20. The lower bound assumes moderate growth with persistent market challenges. The upper bound requires accelerated decentralized application development and increased institutional blockchain adoption. Several specific developments could influence 2026 price levels.
Protocol upgrades scheduled through 2025-2026 will enhance The Graph’s capabilities. The New Era roadmap introduces improved query performance and additional data sources. Expanded support for non-EVM blockchains could increase addressable market. Enhanced delegation mechanisms may attract more passive participants. These technical improvements typically correlate with increased network usage and token demand.
- Base Scenario ($0.45-0.75): Moderate Web3 growth with GRT maintaining current market position
- Bull Scenario ($0.75-1.20): Accelerated dApp development and increased institutional usage
- Bear Scenario ($0.25-0.45): Regulatory challenges or competitive pressure limiting growth
GRT Price Prediction 2027: Maturation and Institutional Adoption
The 2027 prediction period coincides with potential mainstream blockchain integration across traditional industries. GRT price could range from $0.80 to $2.50 depending on adoption trajectories. The lower range assumes gradual enterprise blockchain implementation. The higher range requires significant traditional finance migration to decentralized infrastructure. Institutional participation often brings increased stability but also different investment patterns compared to retail cryptocurrency markets.
Network effects become increasingly important by 2027. As more applications build on The Graph, the protocol becomes more valuable to all participants—a classic network effect. Additionally, data composability across applications creates synergistic value. These dynamics could create non-linear growth if critical adoption thresholds are reached. However, technological evolution might also introduce new indexing approaches that challenge The Graph’s dominance.
GRT Price Prediction 2028-2030: Long-Term Value Proposition
The 2028-2030 period represents The Graph’s potential maturation as essential Web3 infrastructure. Price predictions for this timeframe show the widest variance due to compounding uncertainties. Conservative estimates suggest $1.50-$4.00 ranges, while optimistic scenarios project $5.00-$10.00+ if blockchain achieves mass adoption. These predictions necessarily incorporate greater speculation about technological and regulatory developments that remain unpredictable today.
Long-term value depends on several structural factors. The Graph’s ability to maintain technical superiority against emerging competitors will prove crucial. Protocol governance decisions regarding fees, incentives, and upgrades will impact economic dynamics. Broader blockchain scalability solutions could either increase or decrease demand for specialized indexing services. Macroeconomic conditions and cryptocurrency regulatory frameworks will create contextual market environments.
Risk Factors and Alternative Scenarios
Several risk factors could significantly alter GRT’s price trajectory. Technological disruption through new indexing paradigms might reduce The Graph’s relevance. Regulatory actions against decentralized protocols could limit growth in certain jurisdictions. Broader cryptocurrency market collapses would inevitably impact GRT despite its utility. Protocol governance failures or security vulnerabilities could undermine network trust. These risks necessitate cautious interpretation of long-term predictions.
Comparative Analysis with Similar Infrastructure Tokens
The Graph operates within the blockchain infrastructure sector alongside projects like Chainlink (oracles), Filecoin (storage), and Helium (wireless networks). Historical analysis shows infrastructure tokens often demonstrate different price patterns compared to application-layer tokens. They typically show less volatility during speculative bubbles but maintain value better during bear markets due to continued utility. This pattern suggests GRT might follow similar infrastructure token dynamics rather than mimicking general cryptocurrency movements.
Market capitalization comparisons provide additional context. The Graph’s current market position among infrastructure tokens reflects its adoption stage relative to more established projects. As the protocol matures, its valuation relative to peers will indicate market perception of its importance within the Web3 stack. Significant deviation from comparable projects might signal either overvaluation or unrecognized potential depending on underlying fundamentals.
Conclusion
The Graph price prediction from 2026 through 2030 depends fundamentally on protocol adoption rather than speculative trading. GRT’s value proposition as blockchain indexing infrastructure positions it uniquely within the cryptocurrency ecosystem. While price predictions necessarily involve uncertainty, The Graph’s established utility and growing network usage provide substantive foundations for analysis. Investors should monitor query volume, subgraph development, and network participation metrics alongside price movements. Ultimately, GRT’s long-term value will reflect its success in organizing the world’s decentralized data as Web3 continues evolving.
FAQs
Q1: What factors most influence The Graph price predictions?
The Graph price predictions primarily depend on protocol adoption metrics including query volume, active subgraphs, and network participation. Secondary factors include broader cryptocurrency market conditions, competitive developments, and technological advancements in blockchain indexing.
Q2: How does The Graph’s utility differ from typical cryptocurrencies?
The Graph serves as infrastructure rather than currency or direct application. GRT tokens facilitate network operations including indexing, curation, and delegation. This utility creates ongoing demand from participants earning protocol rewards, potentially creating different economic dynamics compared to purely transactional cryptocurrencies.
Q3: What are the main risks for GRT price growth?
Primary risks include technological disruption by superior indexing solutions, regulatory challenges to decentralized protocols, broader cryptocurrency market declines, protocol security vulnerabilities, and governance failures. Additionally, slower-than-expected Web3 adoption would limit query demand growth.
Q4: How accurate are long-term cryptocurrency price predictions?
Long-term cryptocurrency predictions have historically shown low accuracy due to market volatility and unpredictable technological/regulatory developments. Predictions should be interpreted as scenario analyses based on current information rather than reliable forecasts. Most experts emphasize monitoring fundamentals alongside price projections.
Q5: What metrics should investors monitor for GRT valuation?
Key metrics include daily query volume, number of active subgraphs, indexed blockchain networks, network participants (Indexers, Curators, Delegators), protocol revenue, and developer activity. These fundamentals often provide better long-term indicators than price movements alone.
This post The Graph Price Prediction 2026-2030: Unveiling the Critical Path for GRT’s Future Value first appeared on BitcoinWorld.


You May Also Like
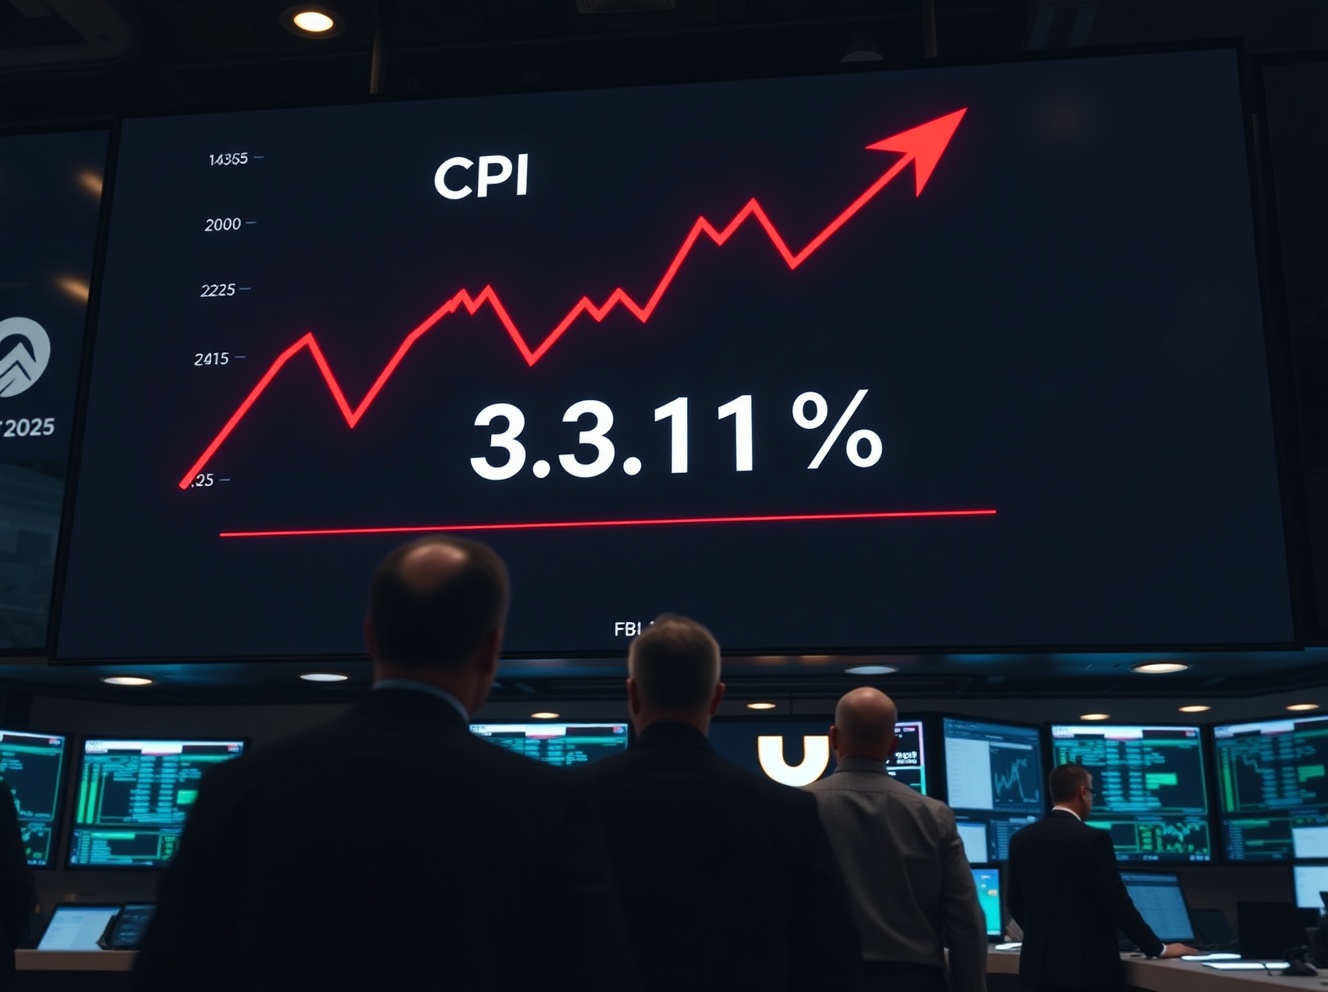
US CPI Set to Show Fastest Inflation in Nearly Three Years as Rate-Cut Bets Fade

Q2 Market Insights: Bitcoin regains dominance in risk-averse environment, ETFs remain critical to market structure