

ZCash Price Today: Hidden Momentum at $468 Defies Extreme Fear
As of July 9, 2026, the ZCash price today hovers at $467.95 USDT — calm on the surface but carrying real tension underneath. ZEC trades above its 200-day EMA while the broader market flashes a Fear & Greed index of just 22, deep inside Extreme Fear territory.
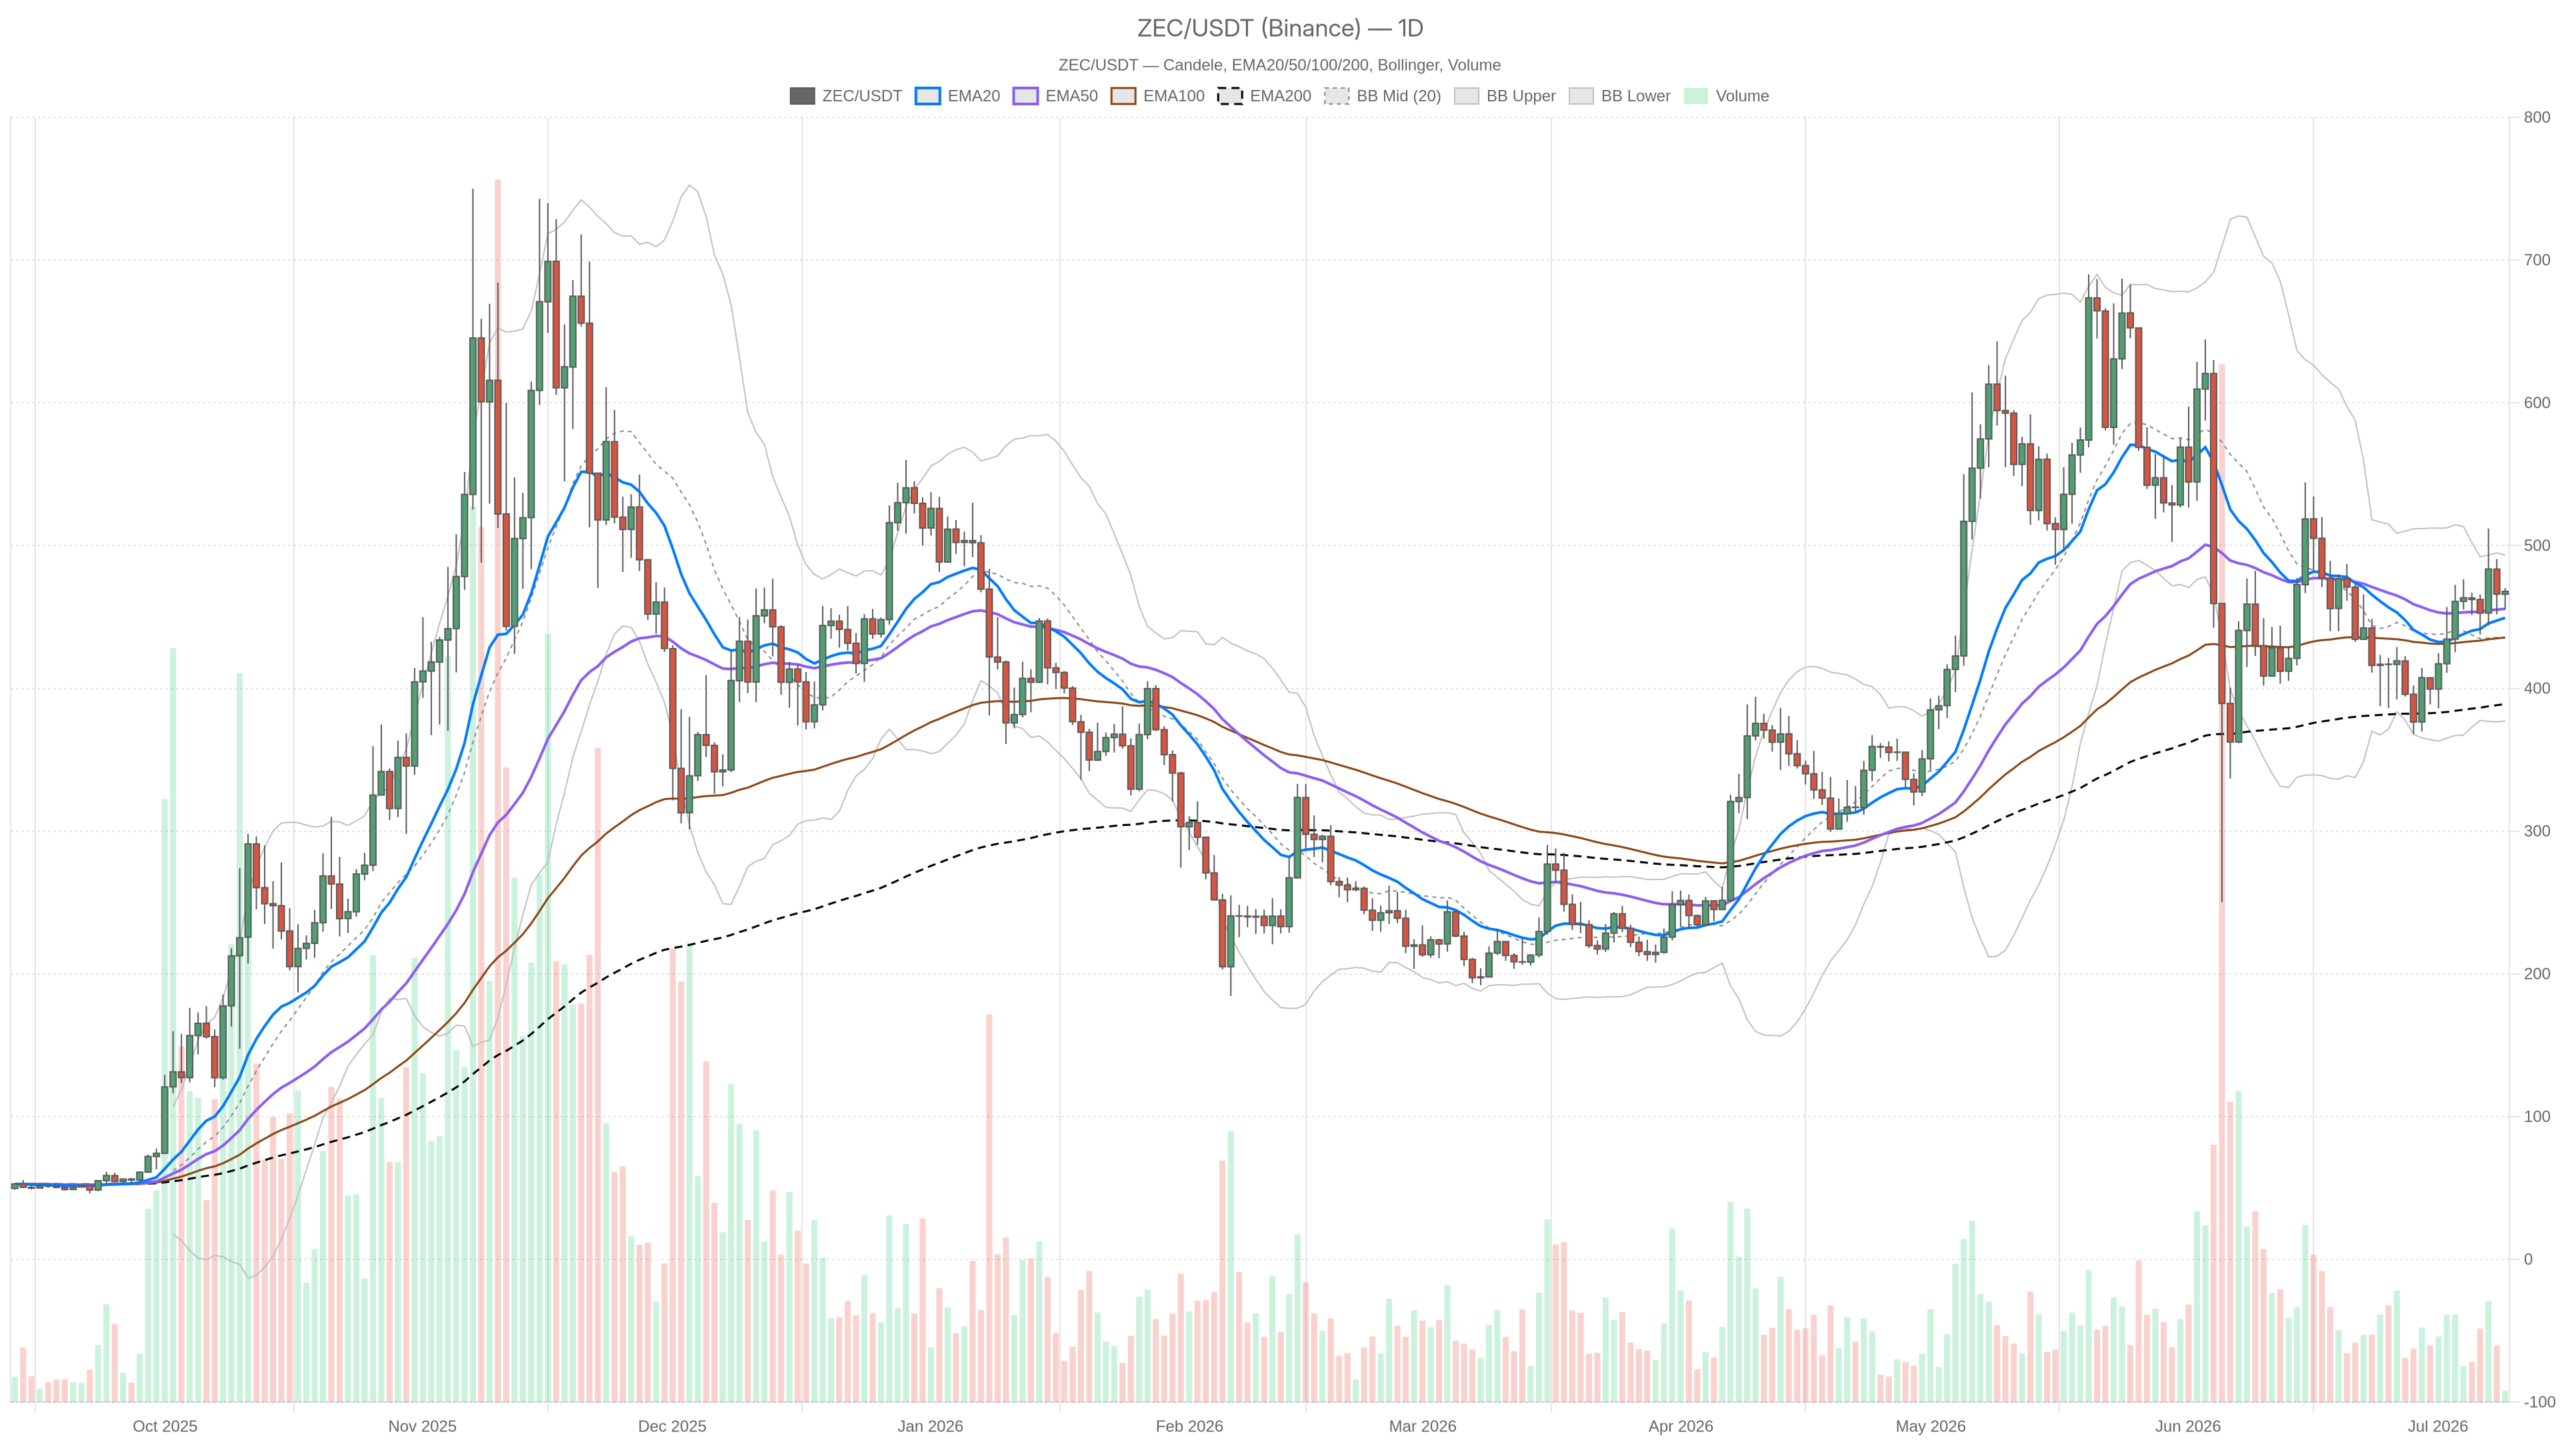 ZEC/USDT — daily chart with candlesticks, EMA20/EMA50 and volume.
Key takeaways
- ZEC holds at $467.95 above all three stacked daily EMAs — a structurally constructive setup despite extreme macro fear.
- The Fear & Greed index at 22 combines with BTC dominance of 56.08% to suppress altcoin risk appetite across the board.
- Daily MACD histogram has swung to +8.60, signalling momentum recovery not yet reflected in price action.
- The ATR of 34.32 warns that daily swings can be sharp — tight stops remain vulnerable to whipsaws.
- A clean break above $473.69 or below $458.74 will likely determine the next directional move.
Daily Chart: Structure Intact but Conviction Thin
On the daily timeframe, the regime is classified as neutral — and the numbers confirm it. The close at $467.95 sits above the EMA20 at $449.43 and the EMA50 at $455.65. It also rests comfortably above the long-term EMA200 at $389.00. Price printing above all three stacked EMAs is structurally constructive. However, the trend has not accelerated — it is simply holding intact without conviction.
The RSI at 53.44 sits exactly in the middle of the range. There is no momentum surge and no exhaustion either. The market is essentially coiled — neither side is winning the argument. More revealing is the MACD configuration: the line at +0.93 has crossed above the signal at -7.67, producing a histogram reading of +8.60. That swing reflects a sharp momentum shift building beneath the surface, though price has not yet responded.
Bollinger Bands place the midline at $435.22, with the upper band at $493.27 and the lower at $377.16. Price currently floats in the upper half of the band range, consistent with a mild bullish drift. Moreover, the upper band has not been tested yet, meaning there is still room before meaningful resistance appears. The ATR of 34.32 serves as a reminder that daily swings of that magnitude are normal for ZEC.
Daily pivot analysis puts the pivot point at $464.49, with R1 at $473.69 and S1 at $458.74. Price is currently trading above the pivot point — a mild positive. A sustained close above R1 would represent a genuine shift in near-term tone, while a drop below S1 would raise immediate concerns.
Hourly Chart: Balanced but Gaining Micro-Traction
The 1-hour chart mirrors the daily neutral stance almost perfectly. The close at $467.87 is above the EMA20 at $464.92 and the EMA50 at $466.04. It also sits well above the hourly EMA200 at $451.69, so the short-term structure stacks bullishly. RSI at 52.99 is flat-neutral. The MACD shows an early-stage recovery pattern: the line at -1.55 remains negative, but the histogram at +0.79 is positive and rising, confirming momentum has stopped deteriorating.
Hourly Bollinger Bands are tightening, with the upper at $470.18 and the lower at $455.71. The midline sits at $462.94. Price hugging the upper half of the channel reinforces the quiet upward drift. The pivot at $467.79 aligns almost exactly with the current price, offering no meaningful directional signal on its own at this timeframe.
15-Minute Context: The Only Timeframe Showing Heat
The 15-minute chart stands out as the only timeframe where something is visibly happening. Price at $468.01 stays above the EMA20 at $463.66 and EMA50 at $463.49. However, it sits just below the EMA200 at $465.66 — a modest short-term resistance worth watching. The RSI at 62.21 pushes toward overbought territory, showing genuine short-term momentum, while the MACD histogram at +1.02 expands and confirms active buyers at this granularity.
This is execution-level data, not a macro thesis. It tells traders that the 15-minute momentum is already running. Chasing at current levels risks walking into a minor pullback. The more disciplined approach is to wait for a reset toward the hourly pivot area around $466.32–$467.79 before committing capital.
The Bullish Case
The bullish scenario hinges on ZEC holding above the daily pivot at $464.49 and pushing through R1 at $473.69 on rising volume. The MACD histogram continues expanding while RSI climbs toward 60+. Price then targets the upper Bollinger Band at $493.27. A close above $493 would open a path toward the $500+ psychological level. Stacked EMAs on both daily and hourly timeframes provide layered structural support beneath any rally. Invalidation arrives with a daily close below the EMA50 at $455.65.
The Bearish Case
The macro context forms the strongest bear argument. With the Fear & Greed index at 22 and BTC dominance at 56.08%, risk appetite is genuinely impaired. If Bitcoin stumbles, ZEC will not escape — and the ATR of 34.32 means a bad day can turn ugly fast. A rejection at R1 combined with hourly RSI rolling over would be an early warning. The real danger line sits at a break below S1 at $458.74, which would quickly put the EMA50 at $455.65 in play. Invalidation: a clean breakout above $473.69 on volume.
What Traders Should Consider
The ZCash price today reflects an inflection point that rewards patience rather than haste. The daily structure is sound: price above all key EMAs, MACD momentum recovering, Bollinger Bands with upside room. Yet the macro environment remains actively hostile to altcoin risk-taking. A Fear & Greed reading of 22 historically precedes continued volatility rather than smooth uptrends. The timeframes are broadly aligned but lack the conviction needed for high-conviction entries.
The asymmetry of the setup depends entirely on how broader market sentiment evolves. If the macro fog lifts and BTC stabilises, ZEC’s clean technical structure positions it for a sharp move higher — with the upper band at $493.27 as a realistic near-term target. If sentiment deteriorates further, however, support levels can dissolve faster than they appear on a chart. Sizing appropriately and defining invalidation levels before the trade remains the only rational approach in this environment.
FAQ
What is driving the ZCash price right now?
ZEC is trading within a neutral technical regime at $467.95, holding above all key daily EMAs. The MACD histogram has swung positive at +8.60, indicating recovering momentum beneath the surface. However, the Fear & Greed index at 22 and BTC dominance at 56.08% keep macro pressure firmly on altcoins, creating a coiled setup without clear direction.
What are the most important levels to watch for ZEC?
On the upside, R1 at $473.69 and the upper Bollinger Band at $493.27 serve as key resistance zones. On the downside, S1 at $458.74 and the EMA50 at $455.65 are critical support levels. A daily close outside either boundary would likely determine the next directional move with conviction.
Is the outlook more bullish or bearish for ZCash right now?
The technical structure leans mildly constructive, with price above all stacked EMAs and recovering MACD momentum. However, the macro environment — marked by extreme fear and elevated BTC dominance — heavily weights the bearish side. Neither case is dominant; the setup is genuinely balanced and waiting for a catalyst to break the stalemate.
Disclaimer: This article is for informational purposes only and does not constitute financial advice, an investment recommendation, or a solicitation to buy or sell any financial instrument or cryptocurrency. The analysis provided is not indicative of future results. Investing in crypto assets and financial markets carries a high risk of capital loss. Always do your own research (DYOR) and consult a qualified financial advisor before making any decision.
Article produced with the assistance of artificial intelligence and reviewed by the editorial team.


You May Also Like

Dogecoin Eyes $0.12 As Traders Look For A Cleaner Breakout Signal

Kraken Leads MiCA-Licensed Crypto Exchanges With $400 Million in Spot Liquidity

Google to Ban Real-Money Prediction Market Extensions From Chrome



