

Pudgy Penguins Price Prediction 2050: From NFT Brand to 100X Monster?
PENGU went from a niche NFT community token to one of crypto's most recognizable meme-brand plays, and now people want to know if the penguin can actually go the distance.
This Pudgy Penguins price prediction 2050 article isn't going to walk you through every candle on the chart; instead, it pulls out the levels that actually matter and lays out what a multi-decade path could realistically look like.
Quick heads up before we dive in: this Pudgy Penguins price prediction 2050 outlook leans entirely on the Fibonacci structure and support/resistance zones already printed on the chart, not on blind guessing.
Quick Snapshot: Where PENGU Sits Today
Current price: roughly $0.0062
All-time high: around $0.046, hit in January 2025
Circulating supply: about 63 billion $PENGU out of an 89 billion max supply
Market cap: sitting near $410–415 million
That's a coin trading roughly 90% below its peak, which tells you $PENGU has already been through a full boom-bust cycle before this long-range forecast even starts.
The Chart's Fibonacci Map: Decoding PENGU's Long-Term Levels
Here's the part that actually shapes this whole prediction.
The monthly chart has a Fibonacci grid drawn from the 2025 low to the 2025 high, and every meaningful level in this forecast comes straight from that grid: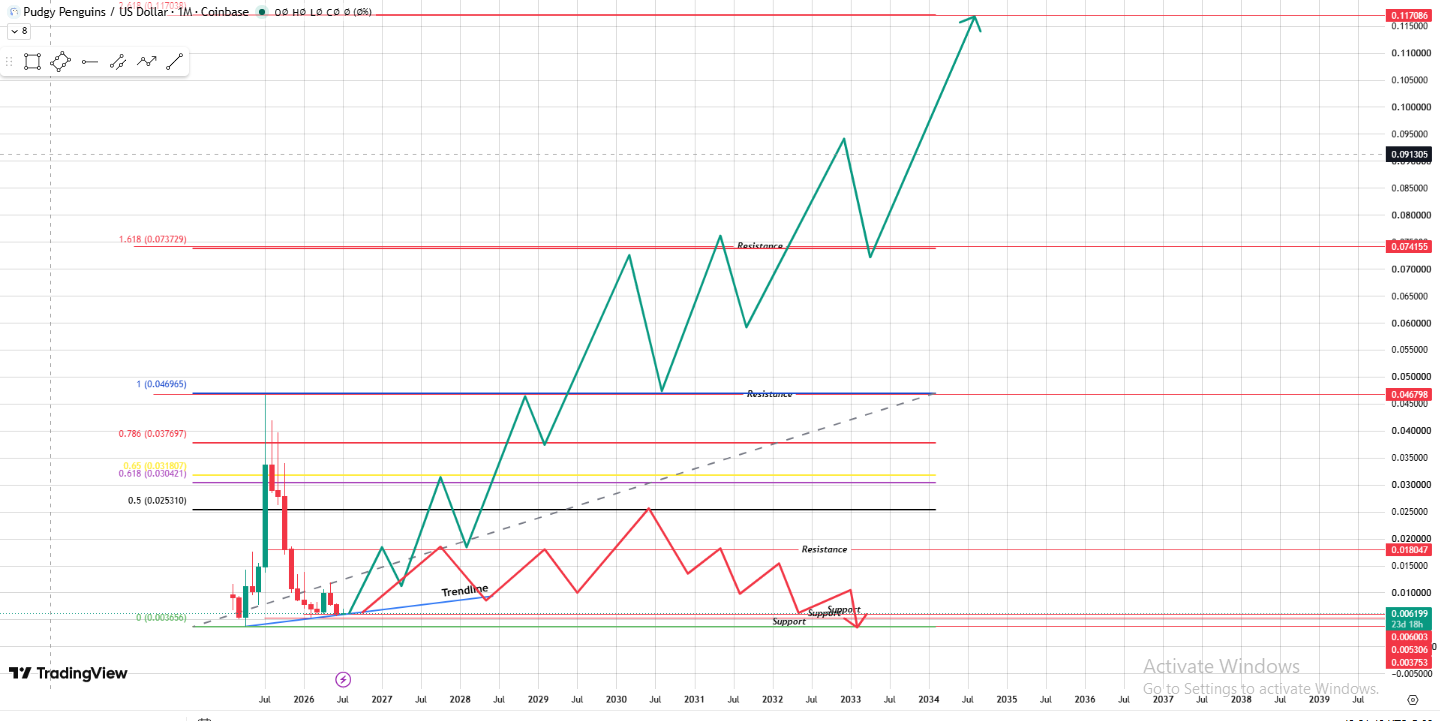
Source: Chart Taken By TradingView
| Fib Level | Price |
|---|---|
| 0 (Base) | $0.003656 |
| 0.5 | $0.025310 |
| 0.618 | $0.030421 |
| 0.65 | $0.031807 |
| 0.786 | $0.037697 |
| 1.0 (Old ATH Zone) | $0.046965–$0.046798 |
| 1.618 (Extension) | $0.073729–$0.074155 |
| Projected Top | $0.117086 |
Right now, PENGU is sitting in a tight support pocket between $0.003753 and $0.006199, basically hugging the bottom of that whole Fibonacci range.
There's also a smaller resistance shelf around $0.018047; that price has to clear before any of the bigger Fib levels even come into play.
Why the Chart Shows Two Very Different Futures
PENGU stuck in a repeating up-down pattern under that $0.018 resistance shelf, never breaking free, eventually rolling back toward support.
It breaks the descending trendline, punches through resistance, climbs past the 0.786 and 1.0 Fib levels, pulls back, and then keeps grinding higher toward the 1.618 extension and finally the $0.117086 target marked at the top of the chart.
Which path plays out basically comes down to whether PENGU can turn that $0.018047 zone from resistance into support.
Everything past that point is a domino effect through the higher Fib levels.
Pudgy Penguins price prediction in 2030
If the bullish structure takes hold, reclaiming the $0.018047 resistance by the back half of the decade puts the 0.5 Fib level ($0.025) and 0.618 Fib level (~$0.030) within reach by 2030.
That's not a huge jump from where PENGU sits today, but it would already represent a multi-x move off current support, which, for a token that's spent most of 2026 range-bound near its lows, would be a meaningful shift in trend.
Pudgy Penguins price prediction in 2035
Assuming the climb continues, the 0.786 Fib ($0.0377) and the 1.0 Fib zone around $0.047 become the targets worth watching through the early-to-mid 2030s.
The 1.0 level is worth flagging specifically; it sits close to PENGU's old all-time high, so reclaiming it wouldn't just be a technical milestone, it would mean the coin has fully erased its post-launch crash.
Pudgy Penguins price prediction in 2040
Past the old high, the chart points toward the 1.618 extension, roughly $0.074.
Getting here would need PENGU to keep pulling fresh capital and attention well past its original NFT-community hype cycle, the kind of staying power very few meme-adjacent tokens actually manage. Still, the projection treats this as the next logical resistance zone once the 1.0 level is cleared.
$PENGU price prediction in 2045 and 2050
This is where the forecast gets genuinely speculative. The chart's arrow tops out near $0.117086, and reaching that by 2050 would put PENGU roughly 17–18x above where it trades today.
It's the kind of number that only makes sense in a scenario where Pudgy Penguins stays culturally relevant for another two and a half decades.
Keeps expanding its merchandise and gaming ecosystem and rides multiple full crypto bull-bear cycles without losing its community.
On the other end, if PENGU never breaks free of its current support band, a 2050 price still sitting in the low single-digit-cents range, even below $0.01, is just as plausible on the chart's bearish path.
Pudgy Penguins Target Table (2030–2050)
| Year | Low Estimate | Mid-Estimate | High Estimate |
|---|---|---|---|
| 2030 | $0.010 | $0.020 | $0.030 |
| 2035 | $0.020 | $0.035 | $0.047 |
| 2040 | $0.035 | $0.055 | $0.074 |
| 2045 | $0.050 | $0.080 | $0.095 |
| 2050 | $0.065 | $0.095 | $0.117 |
The low column assumes PENGU stays capped under the $0.018 resistance shelf for most of the forecast window; the high column tracks the chart's green bullish path all the way to its $0.117086 top.
What Actually Decides This
A few real-world factors sit behind these Fibonacci numbers:
Does PENGU keep its NFT-to-token bridge relevant?
Pudgy Penguins' edge over other meme coins has always been the merchandise, licensing, and NFT community behind it. If that fades, so does the demand story.
Can it clear $0.018047? This is the single biggest technical gate on the whole chart. Every higher Fib target assumes this level flips from resistance to support first.
Supply overhang. With roughly a quarter of max supply still locked, future unlocks could cap rallies if they outpace demand.
Broader meme coin and altcoin cycles. PENGU doesn't move in isolation; it tends to follow the same risk-on/risk-off swings as the rest of the sector.
Bottom Line
PENGU's chart lays out a genuinely wide range of outcomes, and that's the honest takeaway from any Pudgy Penguins price prediction 2050 exercise.
The Fibonacci levels give a structured way to think about targets, but 24 years is long enough for a dozen different market cycles to reshape the story completely.
Treat the $0.117086 top-end figure as an aspirational ceiling built off current chart structure, not a promise, and keep an eye on that $0.018047 level in the meantime; it's the one that actually starts the clock on everything else.
Disclaimer: This article is for informational purposes only and isn't financial advice. Meme coins and NFT-linked tokens like PENGU are highly volatile; always research independently before investing.


You May Also Like

Broadcom Stock: The 1 Number That Could Tell You a Market Turn Is Coming

Bitcoin Exchange Bull Bitcoin Asks France’s Highest Court to Block EU Crypto Tax Rule

AT&T leaves rivals flat-footed as bankrupt carrier folds



