

Gold Price Prediction as Central Banks Add 41 Tonnes in May
Gold price is now trading around $4,160 per ounce after a solid recovery bounce from the lows below $4,000 per ounce last week. The metal hit a low near $3,973 on June 24 and has been grinding higher since.
The broader market is showing signs of stabilization. The dollar index eased slightly. Yields pulled back from their highs. And central banks just reported a massive month of gold buying.
The Kobeissi Letter posted news that caught my attention.
Let me analyze that first before moving to my current gold price analysis and predictions.
Central Banks Add 41 Tonnes in May – Demand Is Back
World central banks purchased +41 tonnes of gold in May , the largest monthly addition since November 2025. This follows +17 tonnes acquired in April, marking the third monthly purchase this year.
Poland led for the second consecutive month at +18 tonnes , bringing its year-to-date total to +64 tonnes. Gold reserves now stand at a record 614 tonnes.
China added +10 tonnes , the biggest monthly addition since December 2024. This increased its official gold reserves to a record 2,331 tonnes , accounting for 9% of total FX reserves – near an all-time high. This also marks the 20th consecutive monthly purchase by the Chinese central bank.
Uzbekistan and Kazakhstan acquired +9 tonnes and +7 tonnes, respectively.
Central bank demand for gold is back. The data confirms that the structural bid from official institutions remains intact despite the recent price correction. Poland’s aggressive accumulation is particularly notable – the country has added 64 tonnes this year alone.
Gold Chart Analysis: Correction Inside a Broader Bull Market
The attached chart shows gold’s price action and the central bank buying data.
Primary trend (long-term): Bullish. Gold has been making higher highs and higher lows since early 2025. The 200-day moving average is still rising, meaning the long-term trend remains positive. The correction from the all-time high looks more like a major pullback inside a broader bull market, not yet a confirmed bear market.
Intermediate trend (last few months): Bearish correction. Since the peak near $5,550, price has formed lower highs, lower lows, and several failed rallies. That tells us momentum has shifted downward even though the longer-term structure is still intact.
Gold Price action phases:
- Phase 1: Strong impulsive rally from $3,300 to $5,500 with very shallow pullbacks.
- Phase 2: Distribution after the top – huge volatility, long wicks, failed breakouts, violent swings. Classic institutional selling into strength.
- Phase 3: Correction. Current price sits around $4,160. Every bounce has produced a lower high, rejection, and continuation lower. That is a bearish sequence. However, price is trying to stabilize around the psychological $4,000 area, creating what could become a medium-term base.
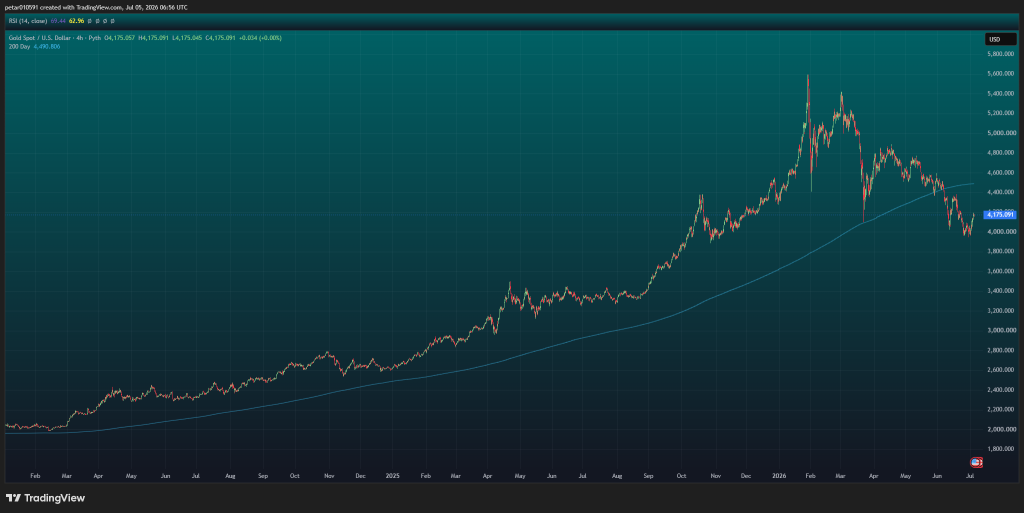 Source: TradingView
The 200-day moving average: The blue MA is extremely important. It is still pointing upward. Price recently tested it and buyers defended it. Currently, price has recovered back above it. That is constructive. As long as gold remains above this MA, bulls still have the long-term advantage. A sustained break below would be much more bearish.
RSI: Current RSI is around 69. That means bullish momentum has returned, but RSI is approaching overbought territory. This is not a sell signal by itself. Instead, it suggests momentum is improving and upside may slow near resistance.
Gold Pricee: Key Levels to Watch
Support Zones:
- Major Support: $3,950–$4,050. Very strong. Multiple reactions, the recent swing low, and the psychological $4,000 level. If this breaks decisively, the next target becomes $3,750–$3,850.
- Secondary Support: $4,300. Old resistance that could become support on future pullbacks.
- Long-term Support: The rising 200-day MA near $4,400–$4,450. This zone will continue rising over time.
Resistance Zones:
- First Resistance: $4,300–$4,400. Recent sellers appeared here. Needs a clean breakout.
- Major Resistance: $4,600–$4,800. Large supply zone. Several failed rallies occurred there. Expect heavy selling.
- Ultimate Resistance: $5,100–$5,500. Previous all-time high area. Breaking this would likely trigger another strong bull leg.
Trendlines: There is a descending trendline connecting the recent lower highs. A breakout above it would indicate the correction is ending, buyers are regaining control, and possible trend continuation.
Read also: History Says Gold Price Best Months May Be About to Begin: The Chart?
Gold Price Prediction
Bullish Scenario: If buyers break $4,300, then $4,400, then $4,600, then $4,800, then $5,000, a possible retest of $5,500 becomes realistic. This would confirm the correction has likely finished. Probability: ~60%. Reasons: rising 200-day MA, strong long-term uptrend, correction already fairly deep, support holding.
Bearish Scenario: If price fails around $4,300–$4,400 and loses $4,000, likely targets become $3,900, then $3,800, then $3,600. A break under $3,600 would damage the longer-term bullish structure. Probability: ~40%. If macro conditions (stronger USD, higher real yields) remain unfavorable, gold could revisit lower support before resuming its longer-term trend.
Our take: The central bank data confirms that the structural demand for gold is intact. Poland, China, Uzbekistan, and Kazakhstan are all buying. The 200-day MA is still rising. The correction from the $5,500 high has been deep but not destructive.
The $4,000 level held. The bounce is real. But resistance at $4,300–$4,400 is strong. Gold needs to break above that level to confirm the correction is over. Until then, the trend remains neutral to bearish in the short term.
For long-term belivers in gold, the $4,000–$4,100 zone offers a reasonable entry. The central bank buying provides a floor. But short-term traders should wait for a break above $4,300 or a clear rejection before taking a position.
Subscribe to our YouTube channel for daily crypto updates, market insights, and expert analysis.
The post Gold Price Prediction as Central Banks Add 41 Tonnes in May appeared first on CaptainAltcoin.


You May Also Like

Ripple XRP Donation Match Backs Veteran Jobs Drive on July 4

Natural Cure Labs Rebrands to NCL, Launches New Website as Part of Broader Evolution

Agentshub.AI Launches true Agentic AI Platform to Build Autonomous AI Workforces in Minutes


