

Zcash Crypto Today: Bullish at $527 as Fear Index Hits 23
As of June 16, 2026, Zcash is trading around $526.74, holding above key moving averages across all timeframes. A look at Zcash crypto today reveals a bullish technical structure, yet macro sentiment — with the Fear & Greed Index at 23 — tells a different story.
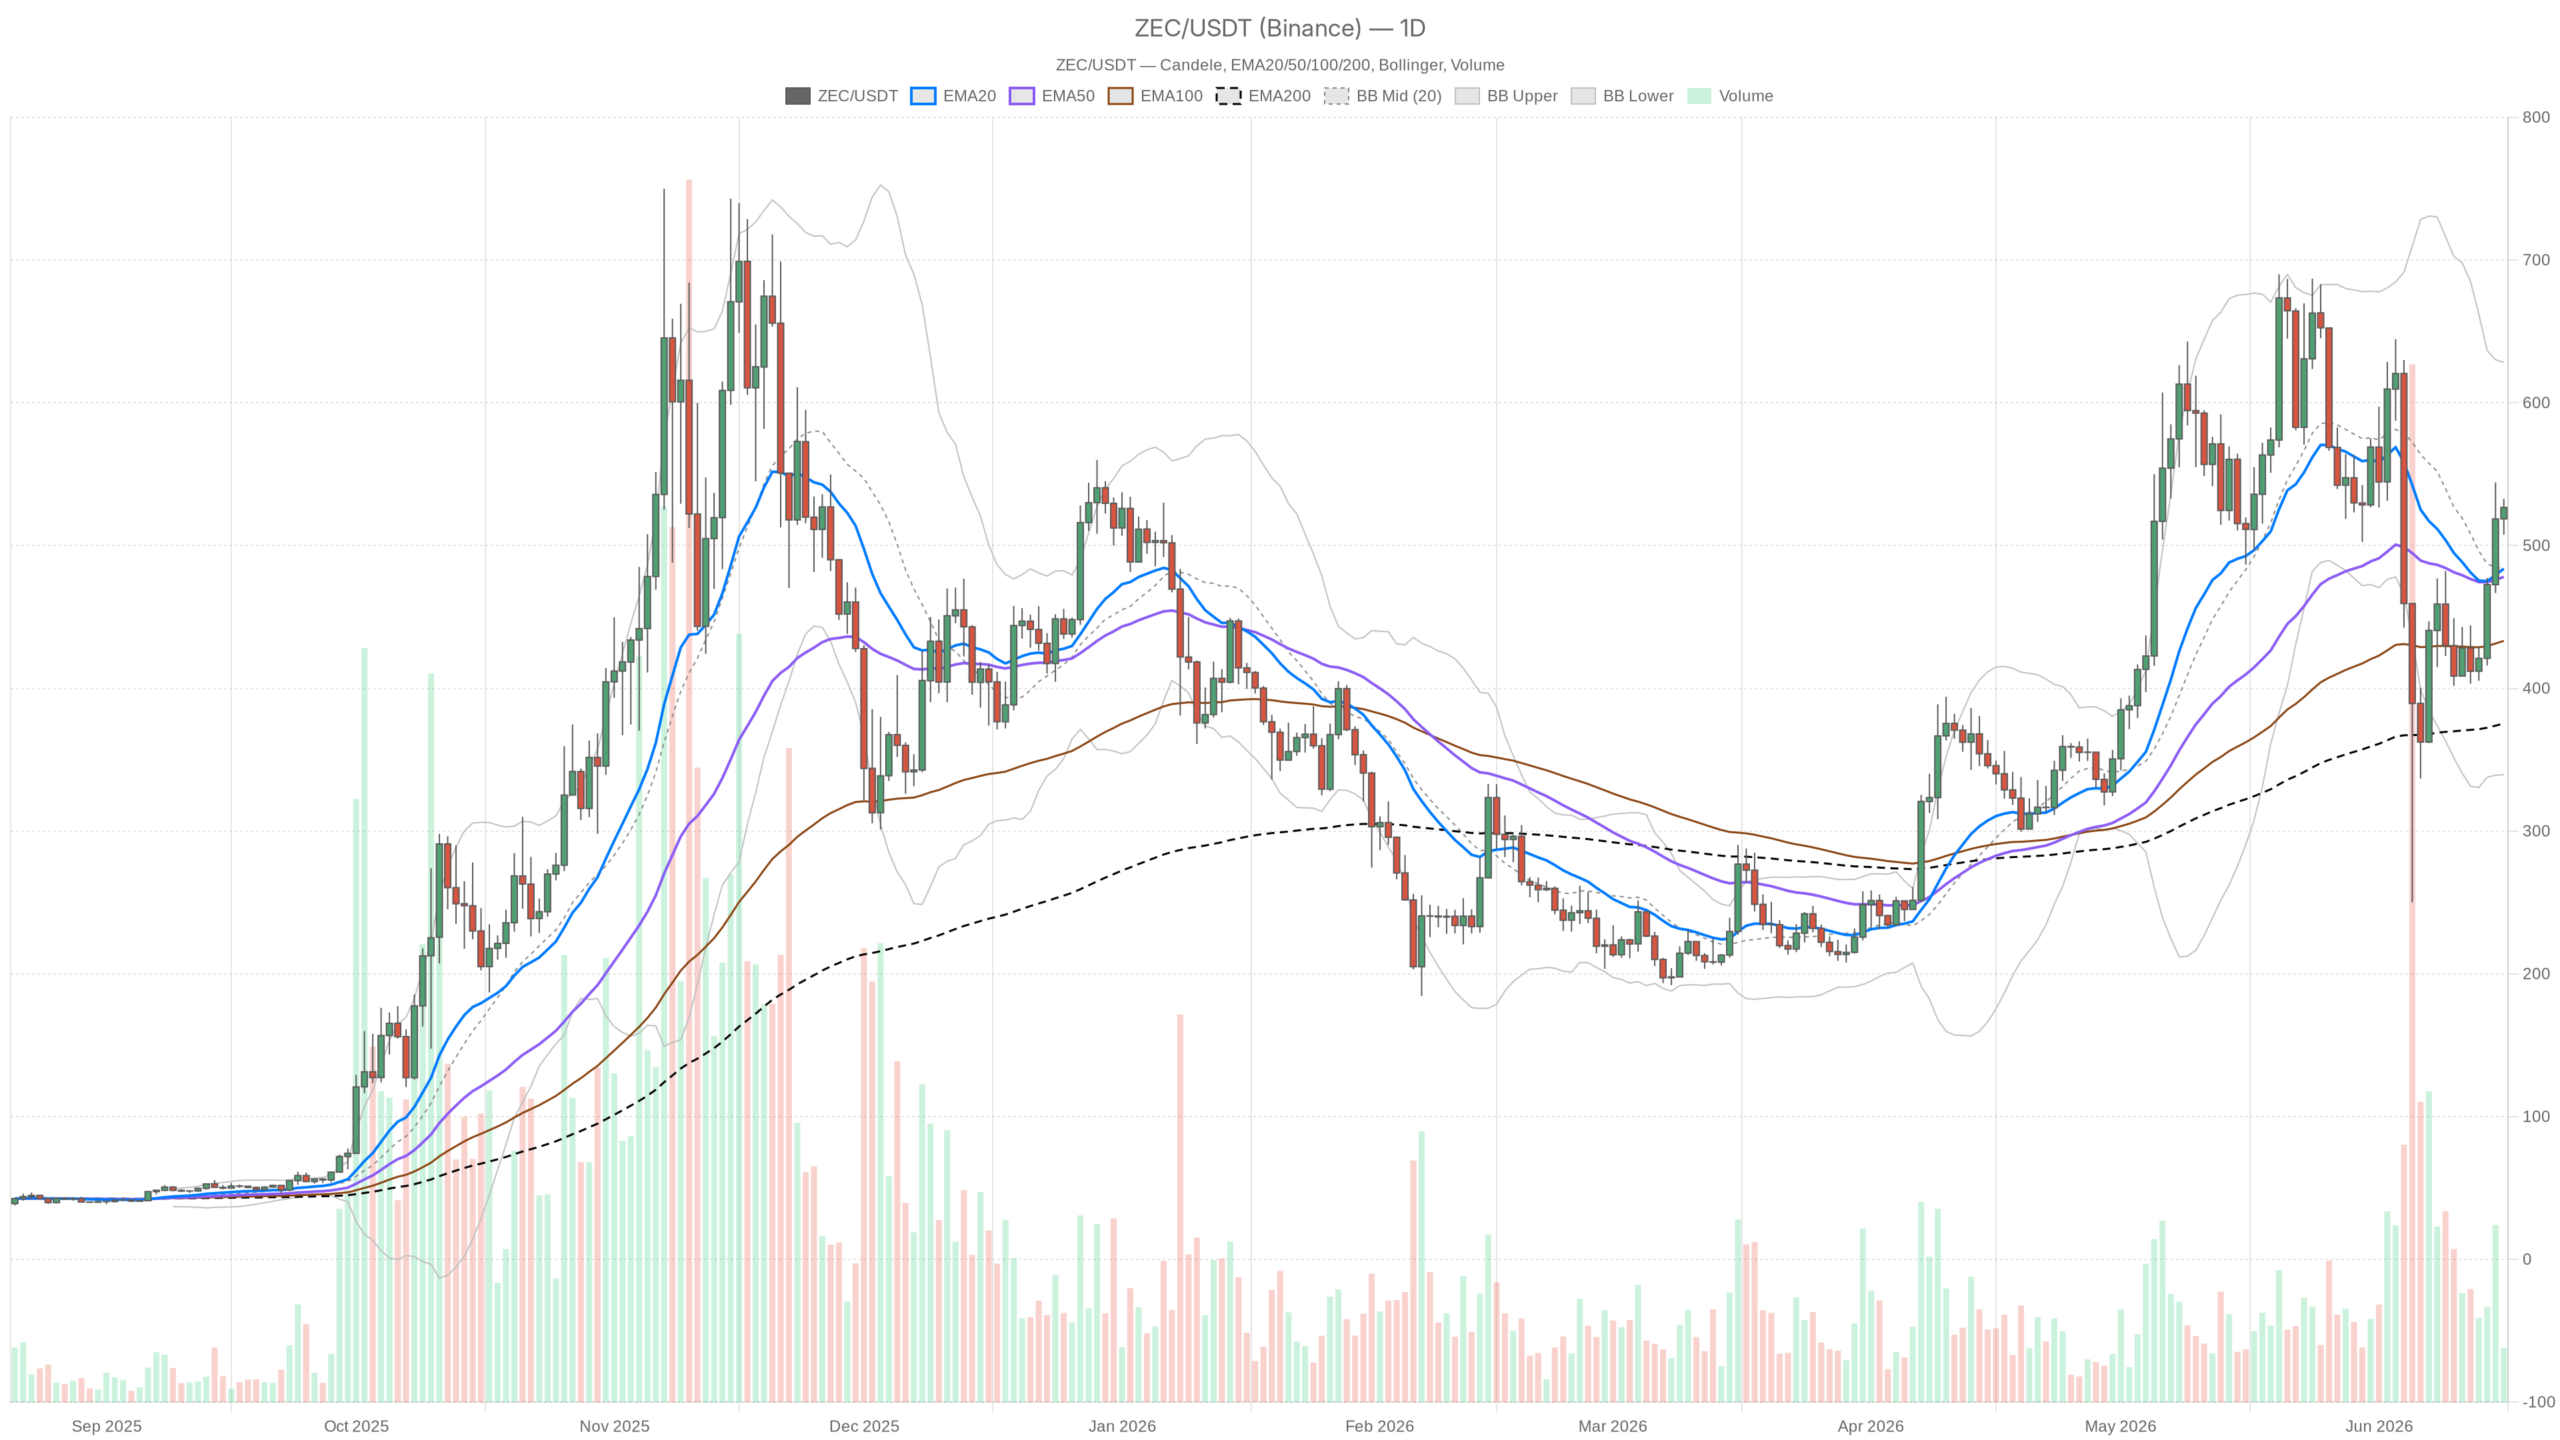 ZEC/USDT — daily chart with candlesticks, EMA20/EMA50 and volume.
Key takeaways
- Zcash trades at $526.74, holding above EMA20, EMA50, and EMA200 on all examined timeframes.
- The Fear & Greed Index sits at 23 (Extreme Fear), while BTC dominance has climbed to 56.5%.
- Daily RSI at 54.22 leaves ample room for movement in either direction without overbought constraints.
- Hourly MACD histogram has turned negative, signaling short-term momentum is beginning to fade.
- A decisive break above $528–$530 or a pullback to $511–$513 offers the clearest risk-reward setups.
The Daily Chart: Bullish Structure With Nuanced Momentum
The daily regime for Zcash crypto today is classified as bullish, and the price action justifies that label. ZEC closed at $526.74, sitting above both the EMA20 at $483.83 and EMA50 at $478.07, and dramatically above the long-term EMA200 at $375.39. That kind of stacked EMA alignment is precisely the trend structure long-side bias relies on. The EMA200 being nearly $150 below current price shows this recovery has been meaningful, not cosmetic.
The RSI at 54.22 on the daily sits in clean mid-range territory. No overbought warning, no distress signal — just a market with room to move in either direction without immediately hitting statistical limits. It is a neutral-to-constructive reading that lets the trend speak for itself.
However, the MACD on the daily is where things get nuanced. The line is at -14.89 against a signal of -20.66, producing a positive histogram of +5.77. Both values remain negative, meaning the underlying structure is still below zero — yet the histogram crossing positive signals momentum is turning upward. This is not a confirmed bullish crossover yet; it is a developing one.
In plain terms: the worst of the momentum divergence appears to be behind us, but this recovery still needs to prove itself above the zero line to be fully convincing.
Bollinger Bands on the daily frame a wide playing field: the midline is at $483.93, upper band at $628.38, and lower band at $339.47. With price above the midline, the bias is constructive, and there is still roughly $100 of headroom before the upper band acts as a natural ceiling. The ATR at $73.93 on the daily is a critical reminder — this asset moves violently. A single daily candle can cover 14% of price range, so position sizing must account for that.
Daily pivot levels show the pivot point at $522.34, with R1 at $537.10 and S1 at $511.99. Price is currently holding above the pivot, which is the minimum condition for near-term bullish continuation. A close below S1 would start eroding that confidence.
Hourly: Momentum Is Stalling Near the Top
Zooming into the 1-hour chart, the picture gets a little less clean. Price at $526.68 sits above the EMA20 at $517.52, EMA50 at $492.88, and EMA200 at $460.47 — all still in proper bullish alignment. However, the RSI has climbed to 64.49, approaching overbought territory without quite getting there. The market is stretched on the short side without being at an extreme.
More telling is the MACD on the 1H: line at 9.41, signal at 11.74, and histogram at -2.33. The histogram has gone negative even though the MACD line remains above zero — a classic short-term momentum fade. The upward impulse that drove price to current levels is decelerating. This does not break the bullish case; it simply says the easy gains in this leg may already be behind us.
Bollinger Bands on the hourly narrow the context considerably: mid at $523.58, upper at $535.86, lower at $511.30. Price is hugging the upper half of the band but has not pushed through it. The 1H pivot sits at $526.41, with R1 at $528.62 and S1 at $524.48. That is an extremely tight range — ZEC is coiling between $524 and $528, waiting for a catalyst.
15-Minute: Compression Without Conviction
The 15-minute frame confirms what the hourly implied: price is digesting rather than pushing. At $526.76, ZEC trades above all its key short-term EMAs, maintaining micro-bullish structure. RSI at 56.11 is utterly unremarkable. MACD histogram is barely positive at +0.06 — the thinnest of margins. The 15M Bollinger Band range spanning $520.25 to $529.26 confirms volatility has contracted sharply, and we are in a compression phase.
For anyone looking at execution context, the 15M setup says this: there is no strong directional signal here. The market is in a wait-and-see mode at the top of a short-term range. A break above $529–$530 on meaningful volume would represent genuine follow-through. A slip below $524 would open the door back toward $511–$513 support.
The Bullish Case
The base case for bulls hinges on the daily trend structure holding. If ZEC can reclaim and sustain above the $527–$528 cluster on the hourly and push through R1 at $537.10, the next logical target is the $550–$560 zone. A daily MACD that continues its upward curl and crosses above zero would add considerable fuel to that move.
Moreover, a sustained push could set up a test of the upper Bollinger Band near $628 over a longer horizon. The stacked EMA structure on all three timeframes aligns in favor of this scenario, provided broader market sentiment does not deteriorate further. This scenario is invalidated if daily price closes below the EMA20 at $483.83 — that would suggest the current rally is failing to hold its gains.
The Bearish Case
Conversely, the counterargument is rooted in macro context and short-term momentum exhaustion. BTC dominance at 56.5% and a Fear & Greed reading of 23 have historically been inhospitable for altcoin rallies to sustain. If risk appetite stays suppressed, ZEC’s position above short-term supports could erode quickly. The 1H MACD histogram already negative and RSI approaching overbought suggest immediate upside is limited.
A failure to break $528–$530 convincingly, followed by a drop through daily S1 at $512, would confirm the rally is losing steam. Below $512, the next meaningful support cluster is around $480–$484, where the EMA20 and EMA50 converge on the daily. This bearish scenario is invalidated if price pushes cleanly through $537 (daily R1) with volume confirmation.
Positioning Reality Check
ZEC is in one of those frustrating in-between zones: technically constructive but macro-challenged. The daily trend is intact and the structure is bullish, yet short-term momentum is stalling while the sentiment backdrop remains hostile. The daily ATR of nearly $74 means a single adverse session can wipe out a week of gains if you are overleveraged. Tight intraday ranges on the 15M signal a compression that typically resolves with a sharp move — and those moves can go either way.
Anyone already long from lower levels has a strong structural argument for holding with a stop below $484. New entries here require patience: waiting for a confirmed break of $528–$530 on the hourly, or alternatively, a pullback to retest $511–$513 with supportive price action. Both setups offer far better risk-reward than chasing into a consolidating range. When the crowd sits in extreme fear and BTC is absorbing capital, altcoin positioning deserves tighter risk management than usual.
FAQ
What is Zcash trading at today?
As of June 16, 2026, Zcash is trading at approximately $526.74, holding above its key EMA20, EMA50, and EMA200 across daily, hourly, and 15-minute timeframes.
Is ZEC’s bullish structure still intact?
Yes, the daily trend structure remains bullish with price above all three major EMAs. However, short-term momentum is showing signs of stalling, with the hourly MACD histogram turning negative even as the MACD line stays above zero.
What are the most critical support and resistance levels?
Key resistance sits at $528–$530 on the hourly and $537.10 at daily R1. Critical support levels are $511–$513 at daily S1 and the $480–$484 zone, where the EMA20 and EMA50 converge on the daily chart.
Disclaimer: This article is for informational purposes only and does not constitute financial advice, an investment recommendation, or a solicitation to buy or sell any financial instrument or cryptocurrency. The analysis provided is not indicative of future results. Investing in crypto assets and financial markets carries a high risk of capital loss. Always do your own research (DYOR) and consult a qualified financial advisor before making any decision.
Article produced with the assistance of artificial intelligence and reviewed by the editorial team.


You May Also Like

Exclusive interview with Smokey The Bera, co-founder of Berachain: How the innovative PoL public chain solves the liquidity problem and may be launched in a few months

CoreWeave (CRWV) Stock Surges 12% on $8.5B GPU-Backed Financing Deal — Here’s the Full Picture

Iran’s army chief warns of ‘total destruction’ for ground invasion


