Shell stock slips below key EMAs as LNG tailwinds fail to lift it

Shell stock is leaning bearish on the daily timeframe as price sits below short‑term trend markers while holding above its long‑term base. The broader uptrend is intact, but near‑term momentum is soft, and rallies face work to reclaim broken levels.
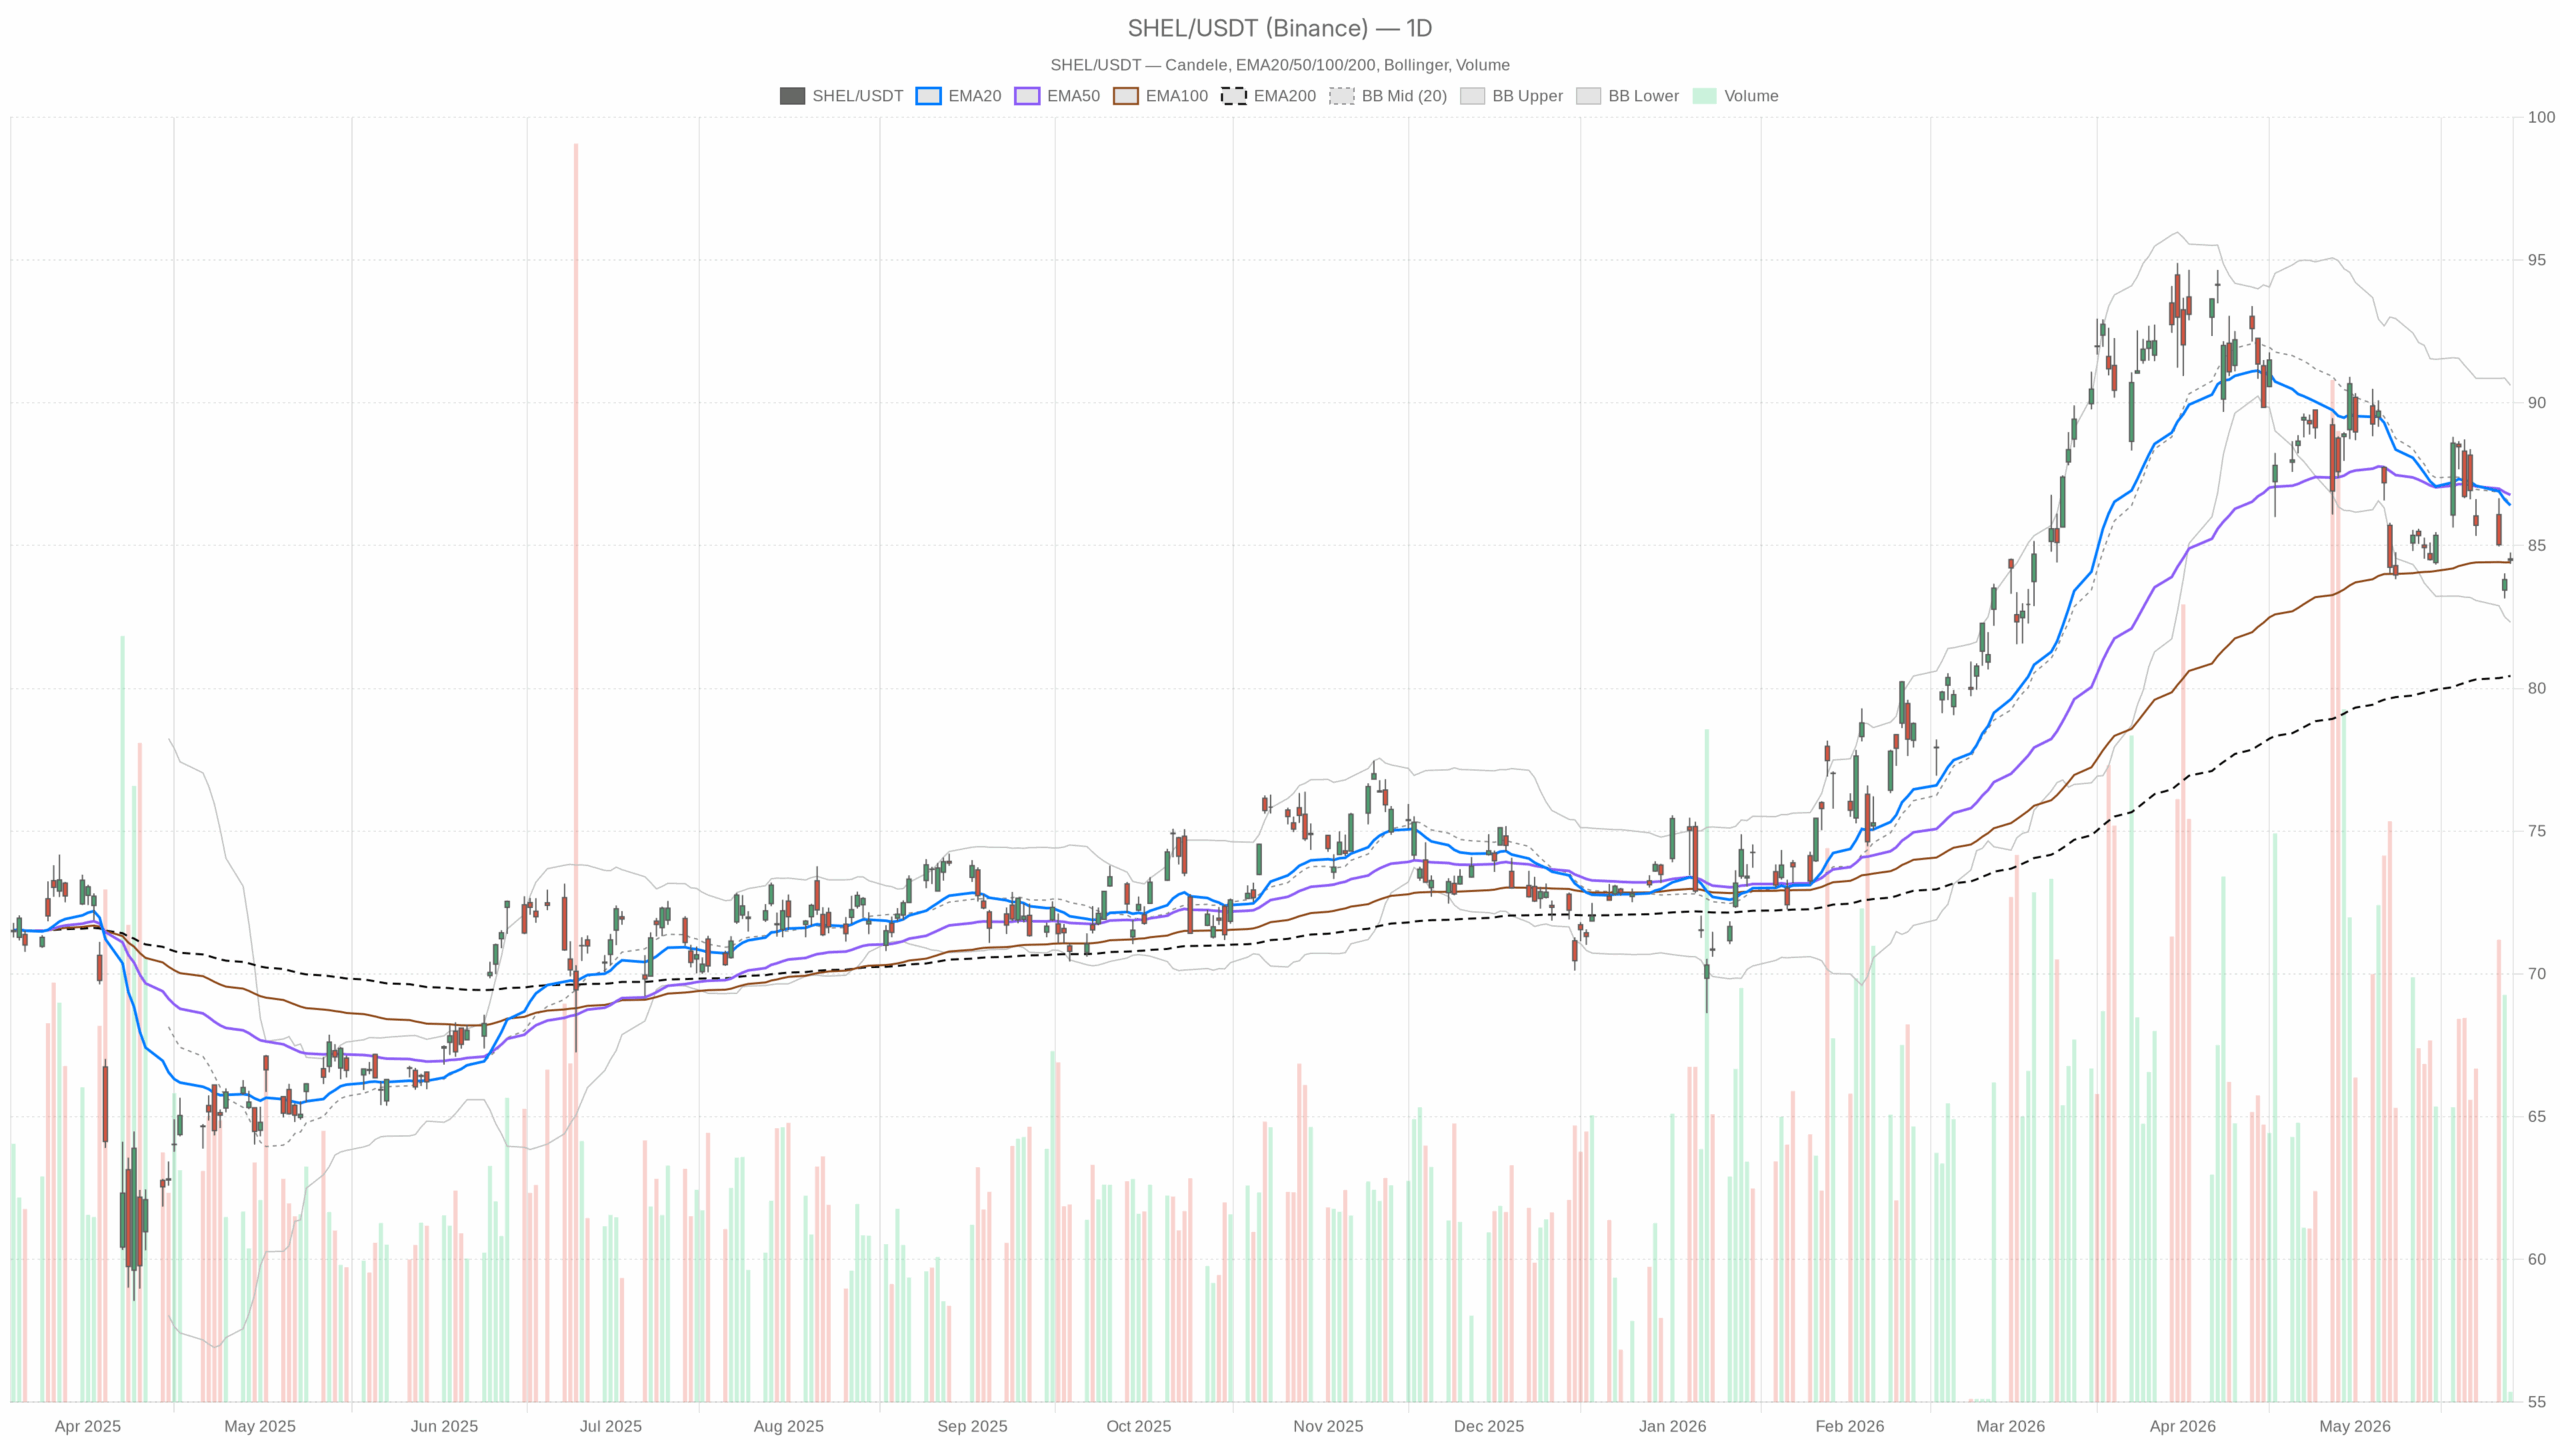 SHEL — daily chart with candlesticks, EMA20/EMA50 and volume.
Shell stock daily technical outlook
On the daily chart, SHEL closed at 84.53, below the 20‑day EMA 86.41 and 50‑day EMA 86.78, but above the 200‑day EMA 80.44. This signals short‑term weakness within a longer‑term uptrend.
The daily RSI(14) is 41.69, below 50, showing fading momentum without being oversold. Meanwhile, the daily MACD is -0.96 versus a -0.83 signal with a -0.13 histogram, indicating negative breadth and only modest downside acceleration.
Daily Bollinger Bands center on 86.47 with a lower band at 82.32, keeping price in the lower half of the range. Therefore, the tone for Shell stock remains cautious. ATR(14) is 1.43, a moderate daily volatility read. Daily pivot stands at 84.55 with R1 84.74 and S1 84.34, a tight intraday map around price.
Intraday context: 1-hour and 15-minute
1-hour structure and pivots
On the 1‑hour timeframe, SHEL trades at 84.56 against the EMA20 84.86, EMA50 85.69, and EMA200 87.38. Price sits below all three, confirming a near‑term downside bias.
The 1h RSI(14) prints 42.51, still weak. However, the 1h MACD is -0.70 versus -0.68 with a -0.02 histogram, which is bearish but flattening and hints at stabilization.
1h Bollinger mid is 84.92 with the lower band at 83.12, keeping price below the mean. At the same time, the 1h ATR(14) sits at 0.49, implying contained intraday swings. 1h pivot is 84.56 with R1 84.76 and S1 84.36, framing a range‑bound open.
15-minute micro-trend and scalp levels
On the 15‑minute chart, price is 84.53 with the EMA20 84.07, EMA50 84.53, and EMA200 85.73. Price sits above the 20 and at the 50, signaling a small intraday bounce under a larger cap.
m15 RSI(14) sits at 60.9, showing near‑term strength. Meanwhile, the m15 MACD is -0.05 versus -0.18 with a +0.13 histogram, reflecting momentum turning up intraday.
m15 Bollinger mid is 83.92 with an upper band at 84.40. Price briefly poked above the upper band, implying a short‑term overextension. The m15 ATR(14) is 0.21, a tight micro‑range. m15 pivot is 84.61 with R1 84.69 and S1 84.46, useful scalp levels.
News and fundamental context
Notably, recent headlines are mixed. Reports highlighted a price‑target bump following Shell’s proposed ARC Resources acquisition, and J.P. Morgan argued the deal sharpens upstream longevity and LNG leadership, a medium‑term positive for Shell stock.
At the same time, shares weakened alongside a sharp oil price drop amid geopolitical headlines, a near‑term headwind. Investors also continue to weigh capital returns and long‑term strategy debates, which remain background noise for day‑to‑day tape.
Trading scenarios for Shell stock
Bullish repair
For the bullish scenario, buyers need to defend the daily S1 84.34 and push through the 1h pivot/R1 band at 84.56/84.76. A sustained reclaim of the daily pivot at 84.55, followed by 85.00–85.20, would set up a run toward the daily EMA20 86.41 and EMA50 86.78, near the Bollinger mid at 86.47. On momentum, a daily RSI move back above 50 and a MACD histogram that turns positive would corroborate the turn.
Bearish continuation
In contrast, the bearish scenario strengthens on a clean break below 84.34 with follow‑through toward 83.50 and the daily lower Bollinger band at 82.32. If downside extends, the 200‑day EMA 80.44 becomes the strategic support to monitor. A daily close below 84.34 with the RSI grinding lower and MACD widening negative would invalidate the near‑term bullish case.
Volatility and positioning
Consequently, levels matter more than narratives while volatility is contained. Daily ATR of 1.43 points to moderate range potential, while the 1h ATR of 0.49 and m15 ATR of 0.21 frame tight intraday action. Therefore, expect two‑way trade within defined bands.
Until daily momentum repairs above the short‑term EMAs, Shell stock remains a sell‑the‑rally or wait‑for‑confirmation market for tactical participants. Overall, positioning should respect the daily bearish tilt, acknowledge 1h stabilization, and use 15m signals only for timing around pivots. Still, uncertainty sits in headlines and crude’s path, so size risk to the ATR and key levels.


You May Also Like

The changing face of elder care in Malaysia — Sayed Mohammad Reza Yamani Sayed Umar

Covéa Chooses Shift Technology as Strategic Partner for Fraud and Risk Management

Not a loophole: Singapore AI export controls let China tap US AI legally