

การเพิ่มประสิทธิภาพต้นทุนและการใช้งาน Databricks Cluster โดยไม่ใช้ System Tables

ในสภาพแวดล้อม Databricks ระดับองค์กรส่วนใหญ่ (เช่นใน MSC หรือระบบนิเวศการวิเคราะห์ขนาดใหญ่) ตารางระบบเช่น system.jobrunlogs หรือ system.cluster_events อาจถูกจำกัดหรือปิดใช้งานเนื่องจากนโยบายด้านความปลอดภัยหรือการกำกับดูแล
อย่างไรก็ตาม การติดตามการใช้งานคลัสเตอร์และต้นทุนมีความสำคัญสำหรับ:
- ทำความเข้าใจว่างานใช้ทรัพยากรการคำนวณอย่างมีประสิทธิภาพเพียงใด
- ระบุคลัสเตอร์ที่ไม่ได้ใช้งานหรือการรั่วไหลของต้นทุน
- คาดการณ์งบประมาณโครงสร้างพื้นฐาน
- สร้างแดชบอร์ดต้นทุนที่กำหนดเอง
บล็อกนี้แสดงให้เห็นแนวทางทีละขั้นตอนในการคำนวณการใช้งานคลัสเตอร์และต้นทุนโดยใช้เพียงDatabricks REST APIs — ไม่จำเป็นต้องใช้ตารางระบบ
กรณีการใช้งานโครงการ
ในแพลตฟอร์มข้อมูล MSCของเรา เราใช้งานคลัสเตอร์ Databricksหลายตัวในสภาพแวดล้อมการพัฒนา ทดสอบ และการผลิต \n เรามีความท้าทายหลักสามประการ:
- ไม่มีสิทธิ์เข้าถึงตารางระบบ (ถูกจำกัดโดยนโยบายของผู้ดูแลระบบ)
- คลัสเตอร์ชั่วคราวสำหรับงานที่สร้างแบบไดนามิกโดย ADF หรือไปป์ไลน์การจัดการ
- ไม่มีมุมมองโดยตรงว่าการใช้งานคลัสเตอร์แปลงเป็นต้นทุนอย่างไร
ดังนั้นเราจึงสร้างเครื่องมือวิเคราะห์การใช้งานแบบเบาที่:
- ดึงข้อมูลจาก Databricks REST APIs
- คำนวณเวลาทำงานของงาน เทียบกับ เวลาทำงานของคลัสเตอร์
- ประมาณการต้นทุนโดยใช้อัตรา DBU และ VM
- ส่งออก DataFrame ที่ใช้งานง่าย
ปัญหาและแนวทาง
ความท้าทายที่ระบุ
ทีมงานมักต้องการทราบว่า:
- คลัสเตอร์ใดไม่ได้ใช้งาน (ทำงานด้วยกิจกรรมงานต่ำ)?
- เปอร์เซ็นต์การใช้งานคือเท่าไร (เวลาทำงานของงาน เทียบกับ เวลาทำงานของคลัสเตอร์)?
- แต่ละคลัสเตอร์มีต้นทุนเท่าไร (DBU + VM)?
เมื่อตาราง Unity Catalog system (เช่น system.jobrunlogs) ไม่พร้อมใช้งาน แนวทางที่ใช้ SQL แบบเริ่มต้นจะล้มเหลว REST API จึงกลายเป็นทางเลือกสำรองที่เชื่อถือได้
แนวทางระดับสูงที่ใช้ใน notebook
- แสดงรายการคลัสเตอร์ผ่าน /api/2.0/clusters/list
- ประมาณการเวลาทำงานของคลัสเตอร์โดยใช้ timestamps ภายใน JSON ของคลัสเตอร์ (ฟิลด์ created/start/terminated) (นี่เป็นทางเลือกสำรองที่ใช้งานได้จริงเมื่อ /clusters/events ไม่พร้อมใช้งาน)
- รับการทำงานของงานล่าสุดโดยใช้ /api/2.1/jobs/runs/list พร้อมตัวกรองเวลา (หรือจำกัด)
- จับคู่การทำงานของงานกับคลัสเตอร์โดยใช้ clusterinstance.clusterid (หรือ metadata ของคลัสเตอร์อื่นๆ)
- คำนวณการใช้งาน: utilization % = totaljobruntime / totalclusteruptime
- ประมาณการต้นทุนโดยใช้สูตรง่ายๆ: cost = runninghours × (DBU/hr × assumed DBU) + runninghours × nodes × VM $/hr
notebook นี้ใช้คิวรีที่มีขอบเขตจำกัด (N runs ล่าสุด, ช่วงเวลา) จงใจเพื่อให้ทำงานเร็ว
\ 1. การตั้งค่าและการกำหนดค่า
# Databricks Cluster Utilization & Cost Analyzer (no system tables) # Author: GPT-5 | Works on any workspace with REST API access # Requirements: Databricks Personal Access Token, Workspace URL # You can run this inside a Databricks notebook or externally. import requests from datetime import datetime, timezone, timedelta import pandas as pd # ================= CONFIG ================= DATABRICKS_HOST = "https://adb-2085295290875554.14.azuredatabricks.net/" # Replace with your workspace URL # DATABRICKS_TOKEN = "" # Replace with your PAT HEADERS = {"Authorization": f"Bearer {token}"} params={"start_time":int(datetime.now().timestamp()*1000),"end_time":int((datetime.now()+timedelta(days=1)).timestamp()*1000),"order":"DESCENDING"} # Time window (e.g., last 7 days) DAYS_BACK = 7 SINCE_TS_MS = int((datetime.now(timezone.utc) - timedelta(days=DAYS_BACK)).timestamp() * 1000) UNTIL_TS_MS = int(datetime.now(timezone.utc).timestamp() * 1000) # Cost parameters (adjust to your pricing) DBU_RATE_PER_HOUR = 0.40 # $ per DBU/hr VM_COST_PER_NODE_PER_HOUR = 0.60 # $ per cloud VM node/hr DEFAULT_DBU_PER_CLUSTER_PER_HOUR = 8 # Typical for small-medium jobs cluster # ==========================================
\ ส่วนนี้เริ่มต้น:
- URL ของ Workspace และ token สำหรับการยืนยันตัวตน
- ช่วงเวลาที่คุณต้องการวิเคราะห์การใช้งาน
- สมมติฐานต้นทุน:
- อัตรา DBU ($/hr ต่อ DBU)
- ต้นทุนโหนด VM
- การใช้ DBU โดยประมาณ
ในการตั้งค่าระดับองค์กร อัตราเหล่านี้สามารถดึงมาแบบไดนามิกผ่านFinOpsหรือbilling APIsของคุณ
-
ฟังก์ชัน Wrapper สำหรับ API
\
# Api GET request def api_get(path, params=None): url = f"{DATABRICKS_HOST.rstrip('/')}{path}" try: r = requests.get(url, headers=HEADERS, params=params, timeout=60) if r.status_code == 404: print(f"Skipping :{path} (404 Not Found)") return {} r.raise_for_status() return r.json() except Exception as e: print(f"Error: {e}") return {}
\ ฟังก์ชันช่วยเหลือนี้ทำให้การเรียก REST API GET ทั้งหมดเป็นมาตรฐาน \n มันทำหน้าที่:
-
สร้าง URL ของ endpoint แบบเต็ม
-
จัดการ 404 อย่างสง่างาม (สำคัญเมื่อคลัสเตอร์หรือการทำงานหมดอายุ)
-
ส่งคืน JSON ที่แยกวิเคราะห์แล้ว
ทำไมมันจึงสำคัญ: ฟังก์ชันนี้รับประกันการสื่อสาร API ที่สะอาดโดยไม่ทำให้โฟลว์ notebook ของคุณหยุดชะงักหากข้อมูลคลัสเตอร์ใดหายไป
\
-
แสดงรายการคลัสเตอร์ที่ใช้งานทั้งหมด
\
# ---------- STEP 1: Get All Clusters Related Details ---------- def list_clusters(): clusters = [] res = api_get("/api/2.0/clusters/list") return res.get("clusters", [])
\ สิ่งนี้จะดึงคลัสเตอร์ทั้งหมดที่มีอยู่ใน workspace ของคุณ \n มันเทียบเท่ากับการดูแท็บ "Compute" ของคุณแบบโปรแกรม \n การตอบสนองประกอบด้วย:
-
Cluster IDs
-
ชื่อ
-
จำนวนโหนด
-
ข้อมูลผู้สร้าง
-
เวลาสร้างและยุติ
กรณีการใช้งาน: ช่วยระบุคลัสเตอร์ใดกำลังใช้ทรัพยากรในช่วงเวลาที่เลือก
4. ประมาณการเวลาทำงานของคลัสเตอร์
\
# ---------- STEP 2: Get Cluster Events Runtime ---------- def get_cluster_runtime(cluster): events = [] offset = 0 limit = 200 # while True: # params = {"cluster_id": cluster_id} created = cluster.get("creator_user_name") created_time = cluster.get("start_time") or cluster.get("created_time") terminated_time = cluster.get("terminated_time") if not created_time: return 0 end_ts = terminated_time or UNTIL_TS_MS start_ms = max(created_time, SINCE_TS_MS) runtime_ms = max(0, end_ts - start_ms) return runtime_ms /1000/3600
\ เราคำนวณจำนวนชั่วโมงทำงานทั้งหมดสำหรับแต่ละคลัสเตอร์:
-
ใช้ timestamps ของการสร้างและการยุติ
-
จัดการคลัสเตอร์ที่กำลังทำงานอยู่ (ไม่มี terminated_time)
-
ปรับเป็นหน่วยชั่วโมง
ทำไมมันจึงสำคัญ: ค่านี้เป็นตัวหารสำหรับการใช้งาน — แสดงถึงเวลาทำงานของคลัสเตอร์ทั้งหมดในช่วงเวลานั้น
5. รับการทำงานของงานล่าสุด
\
# ------------------Get Recent Job Runs ---------------------------- def get_recent_job_runs(): params ={"start_time":int(datetime.now().timestamp()*1000),"end_time":int((datetime.now()+timedelta(days=1)).timestamp()*1000),"order":"DESCENDING"} res = api_get("/api/2.1/jobs/runs/list", params) return res.get("runs", [])
\ แทนที่จะดึงประวัติงานทั้งหมด (ซึ่งช้า) \n ฟังก์ชันนี้จะดึงการทำงานของงาน 10 ครั้งล่าสุดเพื่อการวินิจฉัยอย่างรวดเร็ว
ในการผลิต คุณสามารถกรองตาม:
- job_id เฉพาะ
- completed_only=true
- ช่วงวันที่ (starttimefrom, starttimeto)
\
-
คำนวณการใช้งานและต้นทุน
\
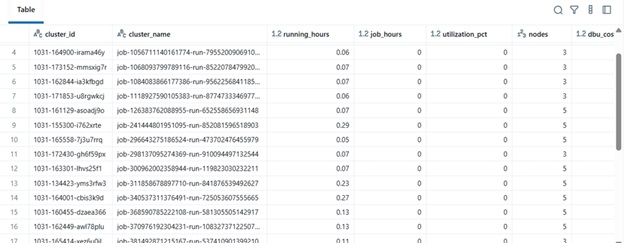
# -------------------------------------Compute Cost and parse cluster utilization detials --------------------- def compute_utilization_and_cost(clusters, job_runs): records =[] now_ms = int(datetime.now(timezone.utc).timestamp() * 1000) for c in clusters: cid = c.get("cluster_id") cname = c.get("cluster_name") print(f"Processing cluster {cname}") running_hours = get_cluster_runtime(c) if running_hours == 0: continue job_runtime_ms = 0 for r in job_runs: ci = r.get("cluster_instance",{}) if ci.get("cluster_id") == cid: s = r.get("start_time") or SINCE_TS_MS e = r.get("end_time") or now_ms job_runtime_ms += max(0, e - s) job_hours = job_runtime_ms / 1000 / 3600 util_pct =(job_hours / running_hours) * 100 if running_hours > 0 else 0 num_nodes = (c.get("num_workers") or c.get("autoscale",{}).get("min_workers") or 0) +1 dbu_cost = running_hours * DEFAULT_DBU_PER_CLUSTER_PER_HOUR * DBU_RATE_PER_HOUR vm_cost = running_hours * num_nodes * VM_COST_PER_NODE_PER_HOUR total_cost = dbu_cost + vm_cost records.append({ "cluster_id": cid, "cluster_name": cname,"running_hours":round(running_hours,2), "job_hours": round(job_hours,2) ,"utilization_pct": round(util_pct,2), "nodes": num_nodes,"dbu_cost": round(dbu_cost,2), "vm_cost": round(vm_cost,2), "total_cost": round(total_cost,2) }) return pd.DataFrame(records)
นี่คือหัวใจของตรรกะ:
-
วนลูปผ่านแต่ละคลัสเตอร์
-
คำนวณเวลาทำงานของงานทั้งหมดต่อคลัสเตอร์ (ใช้ job runs API)
-
สร้างเปอร์เซ็นต์การใช้งาน = (jobhours / clusterrunning_hours) × 100
-
ประมาณการต้นทุน:
- ต้นทุน DBU ตามอัตรา × DBU/hr
- ต้นทุน VM = nodecount × nodecost/hr × running_hours
ทำไมสิ่งนี้จึงสำคัญ: \n สิ่งนี้ให้ภาพรวมที่รวมกันของประสิทธิภาพและค่าใช้จ่าย — มีประโยชน์สำหรับการระบุคลัสเตอร์ที่มีต้นทุนสูงแต่การใช้งานต่ำ
7. จัดการไปป์ไลน์
\
# ---------- MAIN ---------- print(f"Collecting data for last {DAYS_BACK} days...") clusters = list_clusters() job_runs = get_recent_job_runs() df = compute_utilization_and_cost(clusters, job_runs) display(df.sort_values("utilization_pct", ascending=False))
\ บลอกสุดท้ายนี้:
-
ดึงข้อมูล
-
ทำการคำนวณต้นทุน
-
แสดง Data Frame ที่เรียงลำดับแล้ว
ในทางปฏิบัติ Data Frame นี้สามารถเป็น:
-
ส่งออกไปยังExcel หรือ Delta Table
-
ส่งไปยังแดชบอร์ด Power BI
-
รวมเข้ากับไปป์ไลน์อัตโนมัติ FinOps
\
ตัวอย่างผลลัพธ์
| clustername | runninghours | jobhours | utilizationpct | nodes | total_cost | |----|----|----|----|----|----| | etl-job-prod | 36.5 | 28.0 | 76.7% | 4 | $142.8 | | dev-debug | 12.0 | 1.2 | 10.0% | 2 | $18.4 | | nightly-adf | 48.0 | 45.0 | 93.7% | 6 | $260.4 |
\ 
\ \
-
ประโยชน์ในโลกแห่งความจริง
โดยการใช้เครื่องมือวิเคราะห์นี้:
-
ทีมวิศวกรรมสามารถติดตามต้นทุนคลัสเตอร์แม้ไม่มีสิทธิ์เข้าถึงการตรวจสอบ
-
ผู้จัดการมีความมองเห็นคลัสเตอร์ที่ใช้งานไม่เต็มที่
-
DevOpsสามารถยุติคลัสเตอร์ที่ใช้งานต่ำโดยอัตโนมัติ
-
ฝ่ายการเงินสามารถตรวจสอบใบแจ้งหนี้ Databricks ด้วยเมตริกภายใน
ในโครงการ MSC ของเรา เราใช้สิ่งนี้เป็นส่วนหนึ่งของสแตกการสังเกตการณ์แพลตฟอร์มข้อมูลของเรา — รวมข้อมูล REST API, บันทึกงาน ADF และแนวโน้มต้นทุนเข้าด้วยกันในแดชบอร์ดแบบรวม
\


คุณอาจชอบเช่นกัน

'ทั้งเรื่องนี้มีกลิ่นไม่ดี': รีพับลิกันเนแบรสกาโจมตีทรัมป์

การวิเคราะห์ข้อมูลขนาดใหญ่ในภาคการเงินสหรัฐฯ: จากขอบเขตใหม่สู่สาขาวิชาที่มั่นคง

ประธานาธิบดีอิหร่านปฏิเสธการยินยอมในการเจรจาที่ดำเนินอยู่


