

Solana (SOL) Price Analysis: Crypto Analyst Flags $45–$75 Accumulation Zone Amid Record ETF Outflows
TLDR
- Solana posted a 2% gain on Monday following a consecutive four-day decline that resulted in a 5% weekly loss.
- US-listed spot Solana ETFs experienced $7.84 million in net outflows on Friday, marking the fourth-highest single-day withdrawal since inception.
- SOL derivatives saw liquidations exceeding $22.98 million within 24 hours, with long positions comprising $19.18 million of the total.
- The funding rate shifted into negative territory at -0.0141%, indicating traders are compensating to maintain short exposure.
- Critical support remains near the $70–$75 range, with market observers anticipating a possible decline toward $50 if this zone fails to hold.
Solana is attempting to stage a comeback following a challenging week, yet underlying market metrics paint a more cautious narrative. Significant ETF withdrawals, substantial liquidation events, and pessimistic derivatives positioning collectively indicate this rebound could prove temporary.
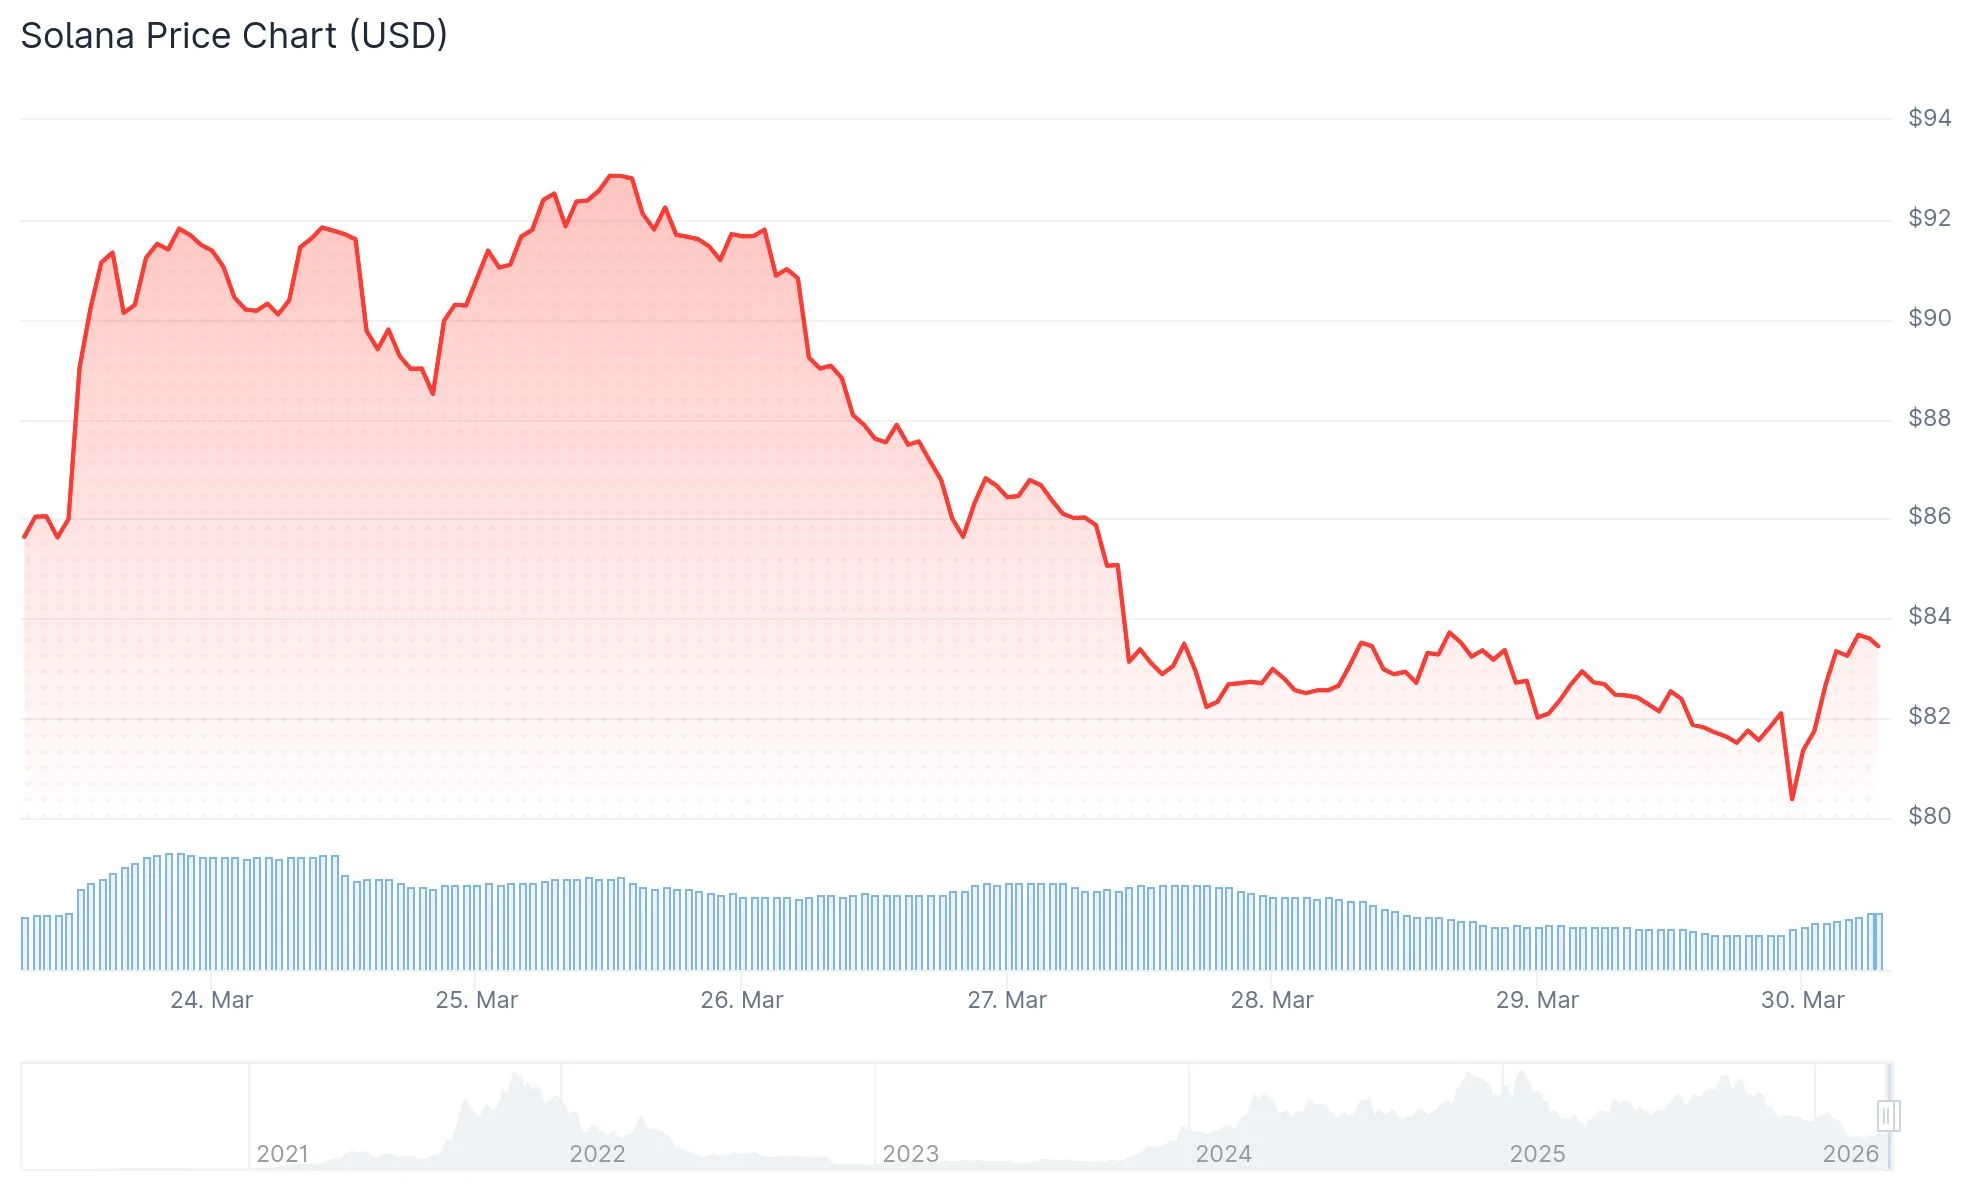 Solana (SOL) Price
Solana concluded the previous week with approximately a 5% decline, briefly testing support levels just above $81 before registering more than 2% gains on Monday. The asset breached a rising trendline support near $88, which technical analysts had identified as a critical juncture.
The 50-day, 100-day, and 200-day Exponential Moving Averages (EMAs) currently remain positioned above the spot price, reinforcing the prevailing bearish technical structure. SOL would require a sustained daily close above $91 to begin reversing this negative configuration.
The MACD indicator has recently crossed beneath its signal line and entered negative territory. Meanwhile, the RSI registers at 42, situated below the neutral 50 threshold, confirming that selling pressure continues to dominate.
US spot Solana exchange-traded funds registered $7.84 million in net withdrawals on Friday. This represents the fourth-largest single-session outflow recorded since these investment vehicles launched, and marks the third straight week of cumulative negative flows.
 Source: SoSoValue
Should institutional withdrawals persist throughout the current week, additional downward pressure would likely intensify against an already vulnerable price structure.
Regarding derivatives markets, $22.98 million worth of SOL contracts were forcibly closed during the past 24 hours. The majority of these liquidations—$19.18 million—originated from long position holders being stopped out.
The negative funding rate of -0.0141% demonstrates that market participants are accepting costs to maintain short positions, providing a transparent indicator of prevailing bearish market sentiment.
Analysts Eye $70–$75 as the Key Zone
Crypto analyst Patel shared a two-week timeframe chart illustrating that SOL has declined approximately 77% from its all-time peak near $250. His technical analysis identifies a significant support and potential entry range spanning $45 to $75, with a Fibonacci retracement level at $52.11 representing a deeper downside objective.
Patel observed that optimistic market sentiment was widespread when Solana exchanged hands above $250, yet has vanished with prices below $80. He interprets the current weakness as a prospective accumulation opportunity for long-term investors, projecting eventual targets of $500 and $1,000 across an extended timeframe.
Additional technical assessment from More Crypto Online utilized a one-hour chart framework to demonstrate that Solana had violated a near-term ascending trendline. This analyst characterized the breakdown as a potential “wave 3” downward movement, suggesting a support corridor between $71.91 and $77.91.
What the Charts Say Now
Near-term support resides at the recent low of $81.44. A violation below this threshold would expose the next level at $75.63, representing the February 24 low that initiated the previous upward trend.
Resistance is concentrated between $84.85 and $87.71, with the 50-day EMA positioned at $91.24 serving as a more substantial barrier.
SOL ETF activity continues under close observation, with Friday’s $7.84 million withdrawal providing the most definitive indication of institutional caution to date.
The post Solana (SOL) Price Analysis: Crypto Analyst Flags $45–$75 Accumulation Zone Amid Record ETF Outflows appeared first on Blockonomi.


You May Also Like

Dunamu Posts 78% Profit Drop as Crypto Trading Slump Hits Upbit’s Fee-Driven Revenue

Critical USDT0 Response to Drift Hack Exposes Stark Contrast in Stablecoin Security Protocols


