Solana (SOL) Struggles After $93 Rejection: Bearish Flag Signals Potential Drop to $40s
Key Takeaways
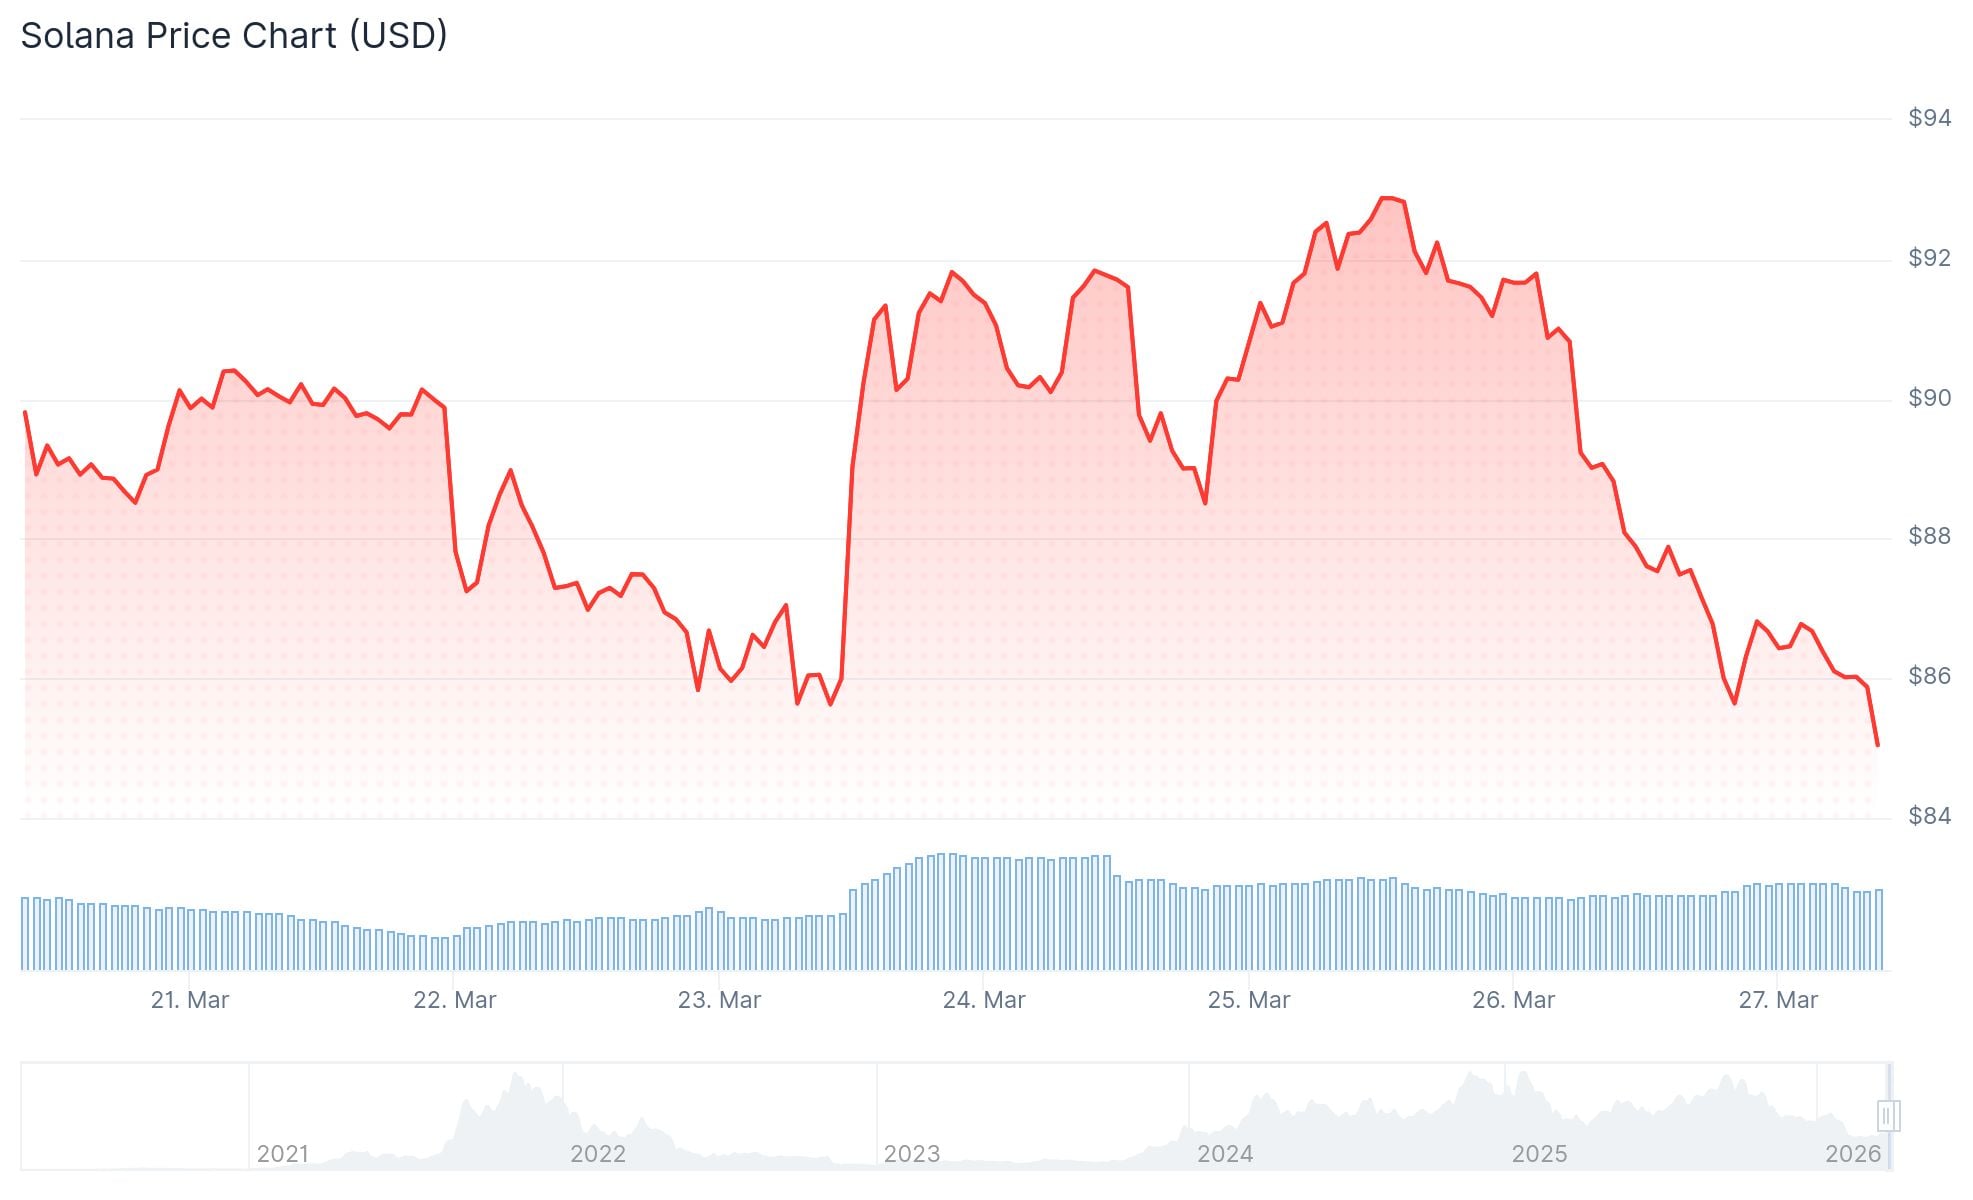
- SOL faced rejection at the $93 level, declining 5.7% over 24 hours to approximately $87
- The token trades beneath its 20-, 50-, 100-, and 200-day moving averages
- Technical indicators including RSI and MACD reflect diminishing price momentum
- A developing bearish flag formation on the daily timeframe suggests potential downside to the $40–$45 zone
- Despite price weakness, Solana handled 44% of worldwide cryptocurrency transactions
Solana (SOL) faces mounting pressure following an unsuccessful attempt to breach the $93 resistance threshold. The digital asset has retreated and now hovers around a critical support area that market participants are monitoring intently.
 Solana (SOL) Price
Currently, SOL changes hands at $87.45. The cryptocurrency recorded $5.62 billion in trading volume during the previous 24-hour period, while maintaining a market capitalization of $50.21 billion. The asset experienced a 5.70% decline within the last day.
Cryptocurrency analyst BitGuru highlighted the $93 rejection in an X platform post dated March 26, 2026. The analyst emphasized that SOL has retreated to a significant historical support area following the failed breakout attempt. The price action at this juncture may determine the token’s trajectory in the coming sessions.
Should demand materialize at current levels, SOL might stage a recovery toward upper resistance thresholds. Conversely, a breach of this support zone could trigger additional losses.
Technical Indicators Point to Weakening Momentum
Solana currently trades beneath all primary moving average benchmarks. The 20-day moving average registers at $88.63, while the 50-day stands at $86.09. The 100-day moving average is positioned at $106.54, and the 200-day rests at $143.24.
Trading below both the 100-day and 200-day moving averages indicates the cryptocurrency remains distant from establishing consistent upward momentum.
The Relative Strength Index reads 47.66, positioned below its signal line of 52.54. Meanwhile, the MACD line registers 0.127, trailing its signal line of 0.232. The relatively neutral MACD histogram suggests minimal directional strength in either direction.
Bearish Flag Formation Suggests Downside Potential
Chart analysis reveals a bearish flag pattern developing on the daily timeframe—a technical setup resembling a formation observed earlier this year. During that previous occurrence, Solana experienced a substantial breakdown following the pattern’s completion.
The present formation displays price consolidation within an ascending channel following a significant decline. Should a breakdown materialize from these levels, technical projections point toward the $40 to $45 price range within approximately one to two weeks.
Notwithstanding the price challenges, Solana’s blockchain activity demonstrates remarkable strength. The network handled 825,729,338 transactions from a total of 1,867,616,231 blockchain transactions recorded during the assessment period—representing 44% of global cryptocurrency transaction volume.
Analyst Ali Charts observed via X that more than 100 million SOL tokens changed hands between $91.45 and $82.60, identifying this range as the most critical demand area. Should this zone fail, subsequent support levels worth monitoring include $53.10, $35.40, and $23.60.
The post Solana (SOL) Struggles After $93 Rejection: Bearish Flag Signals Potential Drop to $40s appeared first on Blockonomi.


You May Also Like

Stablecoin yield negotiations are pretty much done, Coinbase CLO Grewal says

Solana Faces Bearish Pressure as TD Sequential Points to Possible $90 Drop