

Is XRP A Meme Coin? Analyst Reveals How Whales Are Playing The Game
XRP is trading below $3 after repeated rejections above $2.8 in the past 24 hours. A new chart analysis from crypto MadWhale shows the pressure building inside a descending channel that might push the XRP price down to $2.4. However, what stands out in his analysis is not just the price target; it’s the bigger question of whether XRP is starting to behave like a meme coin that is being controlled by crowd psychology and whale activity.
XRP’s Psychological Cycle That Resembles Meme Coins
In his analysis, which was posted on the TradingView platform, crypto analyst MadWhale outlined the repeating psychological cycle that often dominates meme coin markets and suggested that XRP may not be immune from it.
The cycle begins with excitement, where social media buzz generates hype, followed by greed as traders rush in without much thought. This stage then shifts into social proof, when influencers amplify the golden opportunity narrative to pull in new investors at peak prices. It is at this very moment that whales begin quietly offloading their positions and cause the meme coin to enter a sharp correction. The result is panic selling by small traders, culminating in a capitulation where whales buy back cheap, restarting the cycle all over again.
According to MadWhale, this trend is not limited to meme coins alone, but XRP’s current trading behavior is showing signs of fitting the same mold. MadWhale described whales as “masters of illusion,” capable of buying large chunks to pump the price, spread optimism, and then sell into the frenzy.
This strategy is starting to create a cycle of retail fear and greed in XRP, where smaller traders are often left holding losses while whales re-enter the market at bargain prices. He noted that technical tools like Volume Profile, RSI, and the Fear and Greed Index can expose these plays. For instance, heavy volume accumulation at specific levels combined with overbought RSI readings and extreme greed sentiment show the perfect moment when whales start selling.
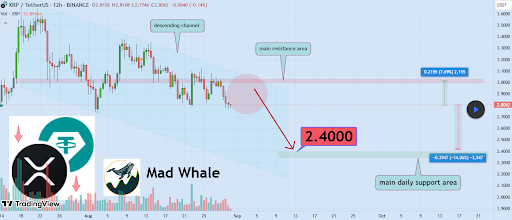
Descending Channel Points To $2.40 Target
According to MadWhale’s chart, XRP is trading within a well-defined descending channel that has shaped its price action since July 19. The repeated rejections around the $3 price zone have caused lower highs that have made it increasingly difficult for bulls to mount a sustained breakout. The most recent rejection was at $3, and the ensuing selling pressure has caused XRP to create successive 12-hour bearish candlesticks.
The analyst’s projection on the chart shows a possible 14% decline to another major support resting around $2.40. This zone has been identified as the main daily support area, and reaching it would mark the latest stage of XRP’s corrective move inside the channel. On the other hand, any rebound attempts would first need to clear the $3 resistance.
At the time of writing, XRP is trading at $2.80, up by 1.4% in the past 24 hours.
You May Also Like

LMAX Group Deepens Ripple Partnership With RLUSD Collateral Rollout

Bitcoin 8% Gains Already Make September 2025 Its Second Best
