ChatGPT’s Bitcoin Analysis Flags $112K Support Amid $2.7B Whale Liquidation
ChatGPT’s Bitcoin analysis has revealed that Bitcoin is testing key support at $112,398 following a massive $2.7 billion whale selloff involving 24,000 BTC across major exchanges, triggering liquidation cascades. In comparison, MicroStrategy counters with a $357 million accumulation, bringing its holdings to 632,457 BTC.
ChatGPT’s Bitcoin analysis synthesizes 26 real-time technical indicators to assess BTC’s trajectory amid massive whale distribution and institutional counter-accumulation. It also assesses EMA support testing and potential trend reversal signals.
Technical Analysis: Whale Selloff Tests Key EMA Support
Bitcoin’s current price of $112,398.08 reflects a -0.97% decline from the opening price of $113,493.59, establishing a volatile trading range between $113,667.28 (high) and $110,588.00 (low).
This 2.7% intraday range shows controlled selling pressure following the massive whale distribution event.
The RSI at 42.24 approaches oversold territory, providing potential bounce conditions after the selloff-driven decline.
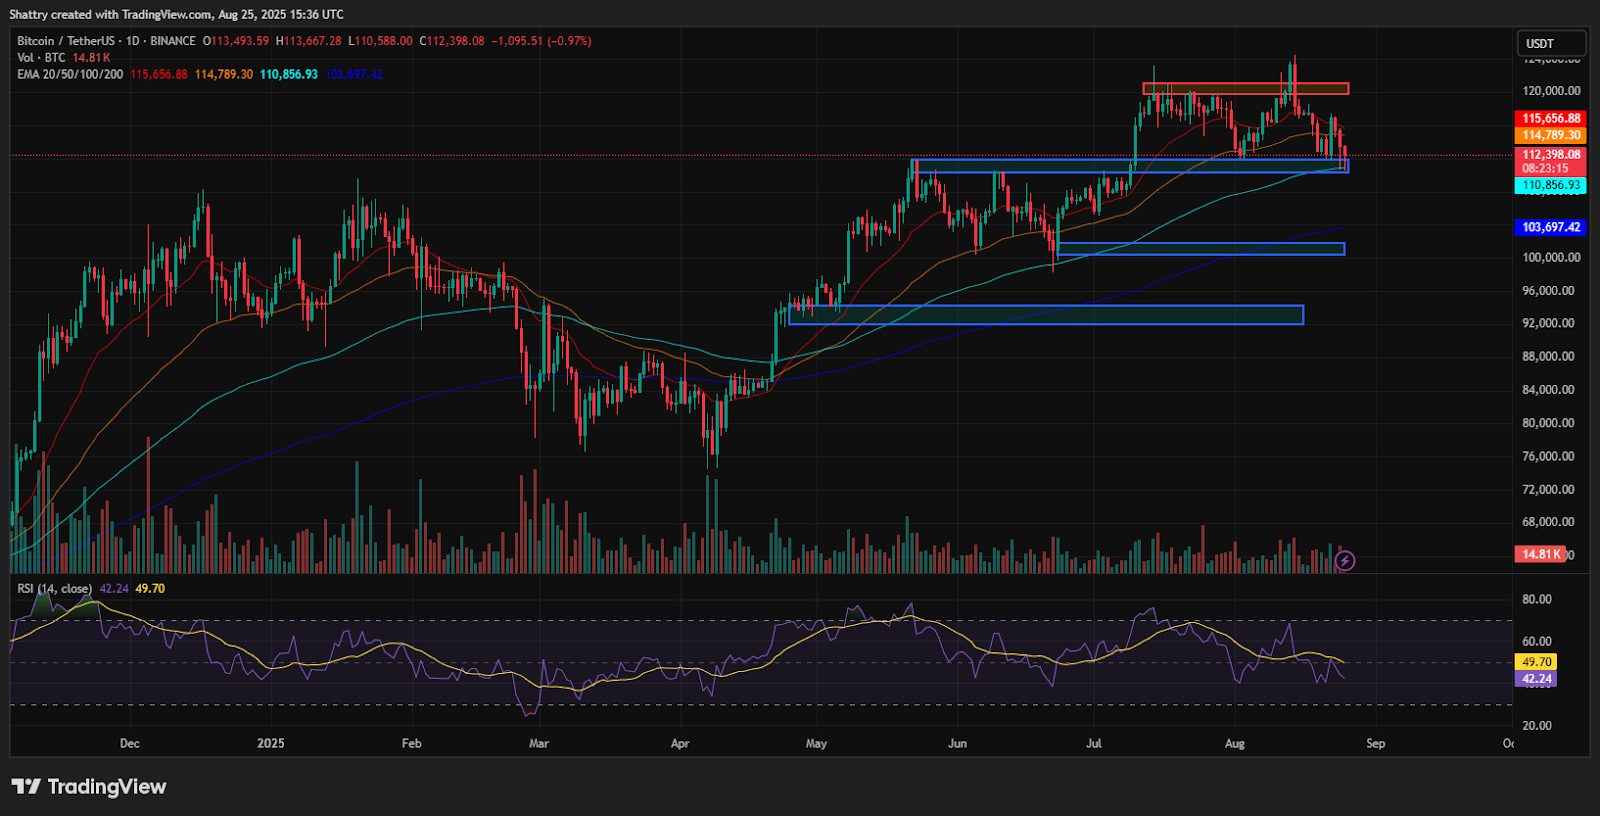 Source: TradingView
Moving averages reveal concerning bearish positioning with Bitcoin trading below the 20-day EMA at $115,656 (-2.8%) and the 50-day EMA at $114,789 (-2.1%), while testing the 100-day EMA support at $110,856 (+1.4%) with the 200-day EMA at $103,697 (+7.7%) providing deeper support.
Similarly, MACD shows a strong bearish structure at -568.66, well below zero, with the signal line at -676.11 and a negative histogram at -107.45, indicating continued momentum deterioration.
 Source: TradingView
Volume analysis shows moderate activity at 14.81K BTC, indicating steady institutional participation during the whale-driven volatility.
In fact, ATR also maintains a reading of 102,285.34, suggesting massive volatility potential for continued large moves based on support test outcomes.
Market Context: Whale Distribution Meets Institutional Counter-Accumulation
Bitcoin’s decline follows a massive whale distribution event involving 24,000 BTC worth approximately $2.7 billion that were dumped across major exchanges.
This systematic selling created liquidation cascades affecting leveraged positions and triggering broader market weakness despite no fundamental catalyst driving the selloff.
The institutional response reveals divergent strategies, with MicroStrategy countering whale selling through a $357 million accumulation of 3,081 BTC, bringing its total holdings to 632,457 BTC, representing 3% of the total Bitcoin supply.
Additional institutional buying includes Japanese firms adding 156.79 BTC and Metaplanet increasing its holdings with an $11.8 million purchase.
Market rotation dynamics show institutional distribution pressure with BlackRock reportedly reducing positions by nearly $200 million while ETF outflows continue.
The whale seller maintains 152,874 BTC worth approximately $17 billion, suggesting strategic positioning rather than a complete exit.
Broader Market Liquidation Impact
The crypto market experienced systematic weakness following the whale distribution event.
Market analysts observe the selloff “triggered a $4K drop in minutes, causing a liquidation cascade, not a natural correction” as leveraged positions faced forced closure during rapid price movement.
The timing coincided with Ethereum’s local high formation, suggesting coordinated selling across major cryptocurrencies.
“Even ETH hit a local high just hours earlier yet dumped right after.” This indicates systematic distribution rather than organic market movement affecting institutional positioning.
Despite the selling pressure, structural factors remain supportive, with analysts noting “no structural reason to flip bearish, just more proof whales still control the game.”
Market participants identified the event as a “liquidation trap” rather than a genuine distribution, with some noting that “this wasn’t a sell-off.”
It was a liquidation trap” targeting over-leveraged positions while institutional foundations remain intact.
Market Fundamentals: Strong Metrics Despite Distribution Pressure
Bitcoin maintains substantial positioning with a $2.23 trillion market cap despite a -1.93% decline during whale distribution phases.
The market cap adjustment accompanies increased volume at $89.33 billion (+74.24%), indicating an active institutional response to whale selling pressure.
Additionally, the 3.93% volume-to-market cap ratio suggests heightened trading activity during distribution events, typical of major market participants repositioning during volatility.
Circulating supply of 19.91 million BTC represents 94.8% of the maximum 21 million supply, with scarcity approaching supporting long-term value despite short-term distribution pressure.
Source: CoinMarketCap
Similarly, market dominance of 57.8% (+1.57%) demonstrates Bitcoin’s relative strength during crypto market weakness, while the 9.87% distance from the August 14 all-time high of $124,457 represents healthy correction territory following whale manipulation events.
LunarCrush data reveals declining social performance with Bitcoin’s AltRank falling to 1.3K during whale distribution events.
A Galaxy Score of 38 reflects cautious sentiment as participants process massive selloff implications for market structure and institutional confidence.
Engagement metrics show increased activity with 97.21 million total engagements (+24.64M) and 225.54K mentions (+86.8K), demonstrating heightened attention during distribution events.
Social dominance of 17.55% maintains visibility while sentiment registers at 76% positive despite selling pressure.
Recent social themes focus on whale manipulation concerns, with community discussions emphasizing “liquidation trap” narratives and double-top formation warnings.
Prominent analyst Crypto Caesar has identified potential CME gap fills around $94K–$96K levels.
ChatGPT’s Bitcoin Analysis: Key Support Defense Required
ChatGPT’s Bitcoin analysis reveals Bitcoin at a key juncture, testing the 100-day EMA support following massive whale distribution pressure.
The support test at $110,856 represents institutional confidence validation versus continued selling pressure from large holders seeking strategic positioning.
Immediate support emerges at today’s low around $110,588, followed by the key 100-day EMA support at $110,856.
Source: TradingView
The 200-day EMA at $103,697 provides major downside protection, while resistance begins at the 50-day EMA ($114,789) and the 20-day EMA ($115,656) levels.
MACD deterioration and RSI approaching oversold conditions indicate potential for reversal if support holds amid counter-accumulation efforts.
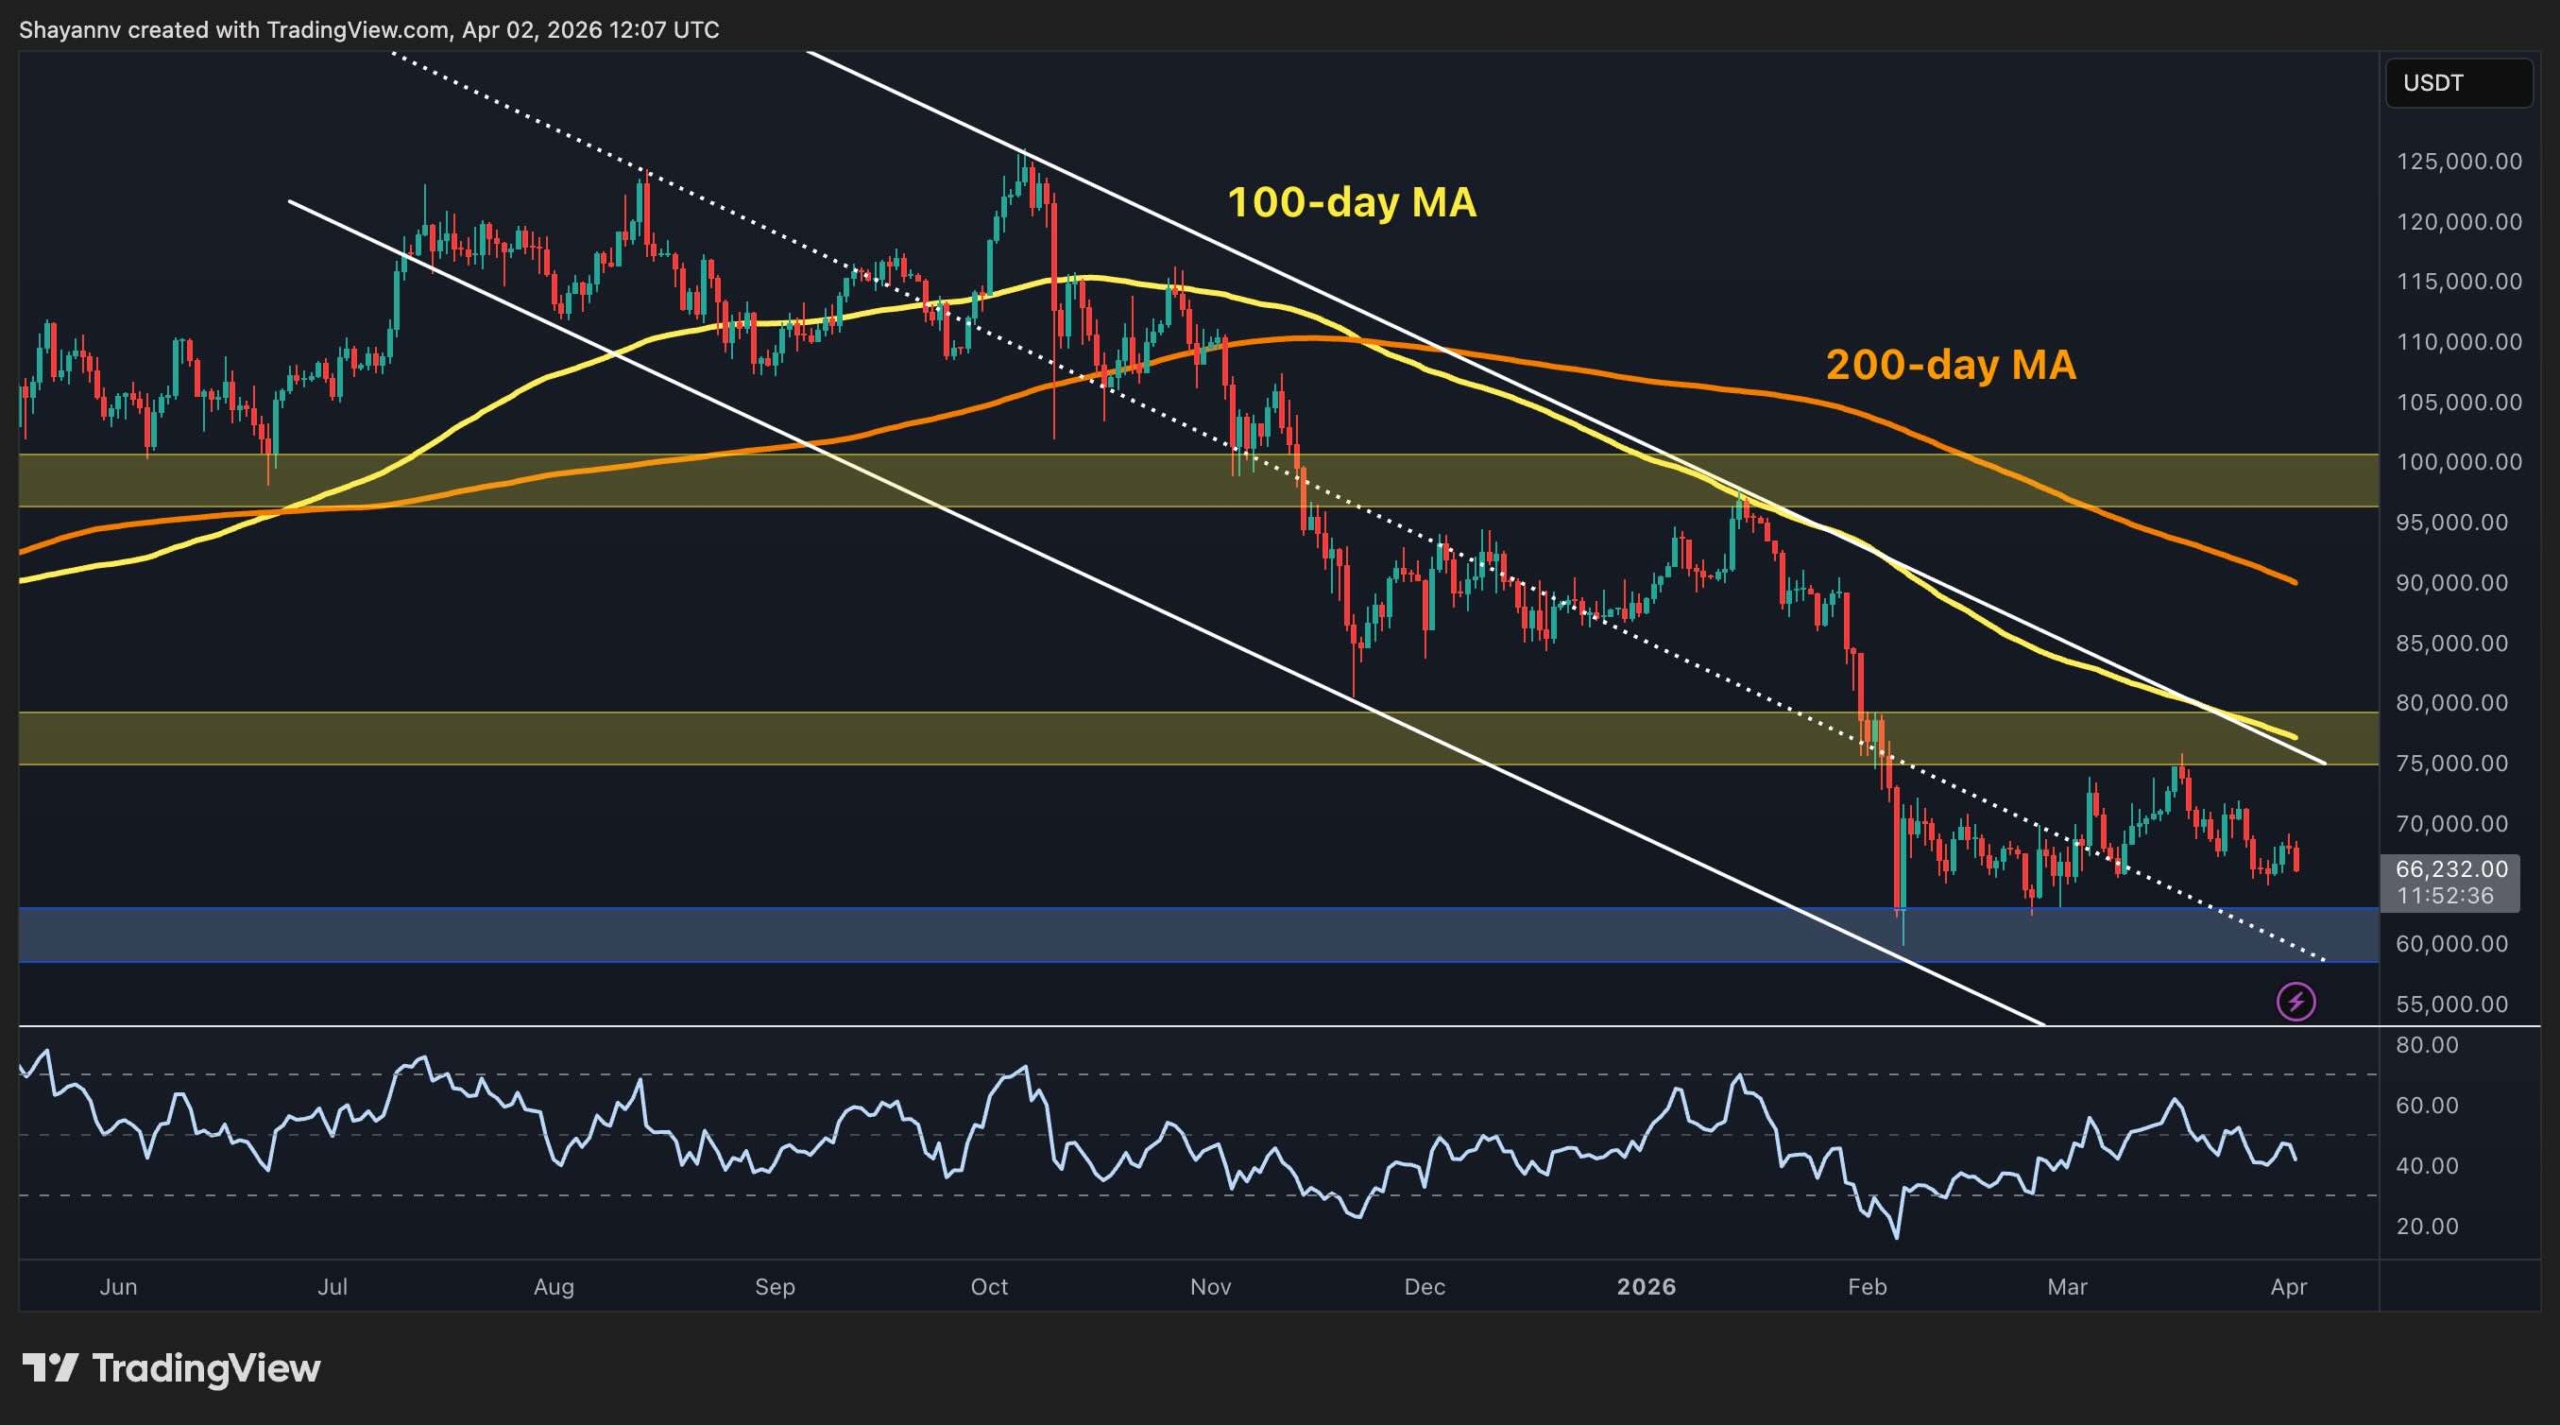
Three-Month Bitcoin Price Forecast: Recovery Scenarios
Support Defense Recovery (40% Probability)
Successful defense of $110.8K support combined with continued institutional counter-accumulation could drive recovery toward $118K–$122K, representing 5–9% upside from current levels.
Source: TradingView
This scenario requires whale distribution completion and oversold bounce validation.
Extended Distribution (35% Probability)
Continued whale selling pressure could result in consolidation between $108K–$115K, allowing distribution completion while institutional accumulation continues during discount pricing opportunities.
Source: TradingView
Deeper Correction (25% Probability)
A break below $110.8K support could trigger selling toward $103.7K-$108K levels, representing an 8–15% downside.
Source: TradingView
Recovery would depend on completing major support, defense, and whale distribution.
ChatGPT’s Bitcoin Analysis: Distribution Pressure Meets Institutional Resolve
ChatGPT’s Bitcoin analysis reveals Bitcoin facing a key support test amid whale distribution pressure countered by strategic institutional accumulation.
The breakdown below short-term EMAs represents market manipulation validation versus fundamental confidence in Bitcoin’s long-term trajectory.
Next Price Target: $118K-$122K Within 90 Days
The immediate trajectory requires decisive defense of $110.8K support to validate institutional confidence over whale distribution pressure.
From there, selling exhaustion could propel Bitcoin toward $118K psychological resistance, with sustained institutional accumulation driving toward $122K+ recovery levels.
However, failure to hold $110.8K would signal a deeper correction to $103.7K–$108K range, creating an optimal accumulation opportunity before the next institutional wave drives Bitcoin toward new all-time highs above $125K as distribution phases complete.


You May Also Like

Edges higher ahead of BoC-Fed policy outcome

Crypto Supercycle in 2025? DeepSeek Ranks the Best Altcoins to Buy Right Now