

Is XRP About to Lose $1 Again as Market Structure Turns Fragile?
XRP price sits near $1.50 after a sharp decline that erased a large portion of its previous rally. Data discussed by Crypto AiMan on YouTube shows XRP fell more than 30% over the past month from about $2.10 to below $1.50.
The three-month picture looks even heavier, with a drop close to 40% from around $2.40. Such persistent weakness raises a direct question about whether Ripple’s XRP could slide under the psychological $1 level again.
Crypto AiMan explains that a move below $1 remains possible if the broader crypto market continues to weaken. Bitcoin and Ethereum trends still guide sentiment across digital assets, so further downside in major coins could drag XRP price lower during the coming weeks.
Regulatory uncertainty tied to delays around the Clarity Act also adds pressure that may influence short-term confidence.
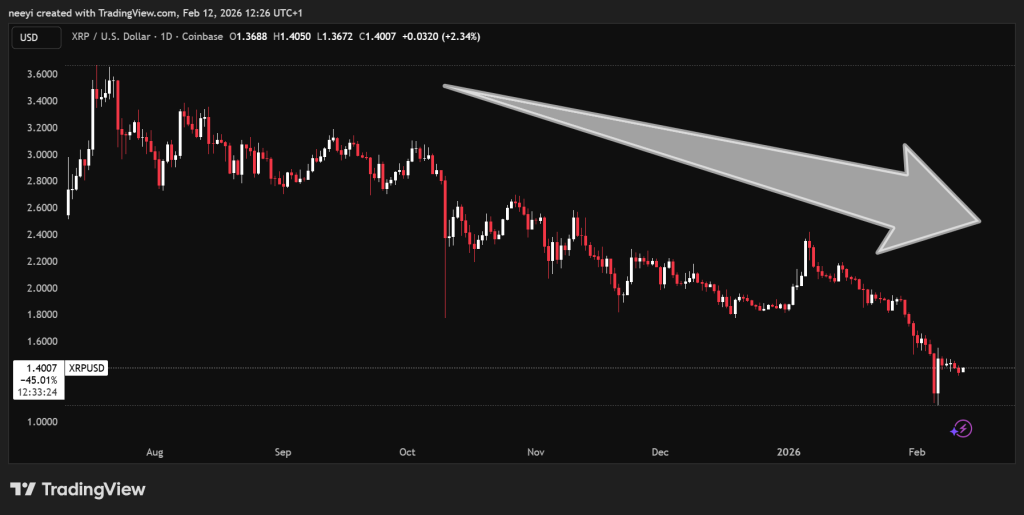 XRP Price Chart Showing Elongated Downtrend
Extreme Fear Levels Suggest XRP Price May Be Near A Bottom
Crypto AiMan points to the current fear and greed index reading near 5 as a key signal. Historical comparisons place this level below panic zones seen during events such as the FTX collapse and earlier bear markets.
Extreme fear often appears close to long term bottoms because selling pressure becomes exhausted after extended declines.
Market wide losses reinforce the bear market narrative discussed by Crypto AiMan. Bitcoin trades roughly 50% below its peak, Ethereum more than 60%, and several large altcoins show even deeper drawdowns.
XRP itself has dropped over 60% from prior highs. Such widespread weakness typically occurs late in bearish cycles instead of the beginning, which supports the idea that downside risk may be limited compared with earlier months.
Technical structure adds another layer to this argument. Crypto AiMan highlights the Relative Strength Index near oversold territory around 30.
Previous moments where RSI reached similar levels coincided with major reversals that later produced strong upward moves. A comparable setup appeared when XRP traded near the $0.40 to $0.50 zone before a rapid rally above $3.
Long-term XRP Potential Depends On Market Recovery And Adoption Narrative
Short-term uncertainty does not remove the possibility of a strong rebound once conditions stabilize. Crypto AiMan emphasizes how XRP historically declines slowly before rising quickly during recovery phases. Past cycles showed long consolidation followed by sudden expansion once sentiment improved.
Fundamental positioning around global payment efficiency continues to shape long-range expectations. Ripple’s technology aims to compete with traditional financial settlement networks, and comparisons with large banking valuations highlight perceived upside if adoption expands.
Crypto AiMan notes that XRP’s fully diluted valuation remains far below trillion-dollar financial institutions, which leaves room for significant appreciation during favorable market cycles.
Read Also: BlackRock Enters Uniswap, UNI Jumps 40%: Bigger Move Coming?
Risk still exists if bearish pressure intensifies across crypto markets. Preparation for both downside and upside scenarios remains essential during volatile periods. XRP price now stands at a critical moment where broader sentiment, regulatory clarity, and technical recovery will decide the next direction.
Subscribe to our YouTube channel for daily crypto updates, market insights, and expert analysis.
The post Is XRP About to Lose $1 Again as Market Structure Turns Fragile? appeared first on CaptainAltcoin.
You May Also Like

UAE Launches First Regulated Stablecoin as ADI Trends Higher

The Ultimate Guide to Professional Dog Grooming: Choosing the Right Tools for a Salon-Finish at Home
