The post LINK Price Struggles Near $8.60 as Reserves Grow and ETF Inflows Diverge From Market Weakness appeared first on Coinpedia Fintech News The LINK price isThe post LINK Price Struggles Near $8.60 as Reserves Grow and ETF Inflows Diverge From Market Weakness appeared first on Coinpedia Fintech News The LINK price is

LINK Price Struggles Near $8.60 as Reserves Grow and ETF Inflows Diverge From Market Weakness

2026/02/07 01:32
3 min read
Chainlink Whales Accumulate as LINK Price Slips Below $13—Is the Bottom Still Ahead

The post LINK Price Struggles Near $8.60 as Reserves Grow and ETF Inflows Diverge From Market Weakness appeared first on Coinpedia Fintech News

The LINK price is trading near $8.60, under pressure despite a fresh catalyst from the Chainlink Reserve, which added over 125,000 LINK in a single update. While broader crypto markets weaken, on-chain accumulation and ETF flows suggest a widening disconnect between price action and underlying demand.

The Chainlink Reserve continues to expand its footprint as a long-term sustainability mechanism for the network. According to official data, the reserve has accumulated 125,454.48 LINK, bringing total holdings to approximately 1.9 million LINK. This reserve is funded through a combination of off-chain enterprise revenue and on-chain service usage, reinforcing its role as infrastructure rather than a market-facing liquidity tool.

Meanwhile, this steady accumulation occurs independently of short-term LINK price USD fluctuations. That separation is notable. Historically, reserves of this nature tend to grow during periods of suppressed market confidence, when usage-driven revenues quietly outpace speculative demand.

At the same time, the reserve’s design reduces reliance on inflationary incentives, aligning with Chainlink’s broader goal of long-term network sustainability rather than cyclical price appreciation.

ETF Inflows Contrast Broader Crypto Outflows

From a flows perspective, Chainlink stands out. While Bitcoin and Ethereum ETFs have experienced consistent outflows during recent market stress, LINK ETF products have yet to record a single day of net outflows. Data shows cumulative inflows of $78.63 million, representing roughly 1.11% of LINK’s market capitalization.

LINK Price Struggles Near $8.60 as Reserves Grow and ETF Inflows Diverge From Market Weakness

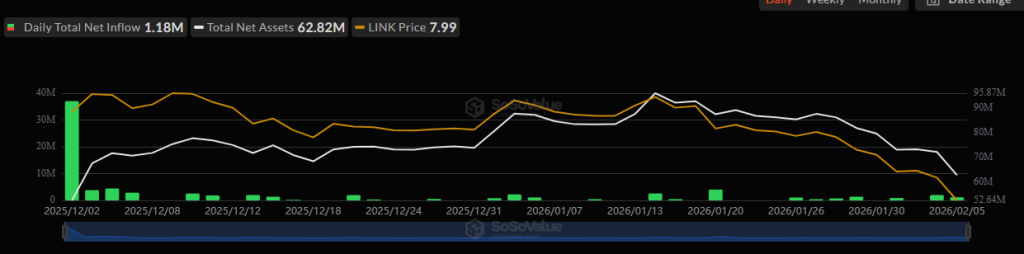
Notably, institutional vehicles such as Grayscale and Bitwise have maintained their exposure even as volatility increased. That persistence suggests portfolio-level conviction rather than momentum-driven positioning. Still, ETF stability alone has not insulated the LINK price chart from downside pressure.

Whale Distribution Adds Near-Term Pressure

That said, on-chain supply distribution reveals a more complex picture. Addresses holding between 1 million and 10 million LINK have been net sellers over the past 48 hours. This cohort historically acts as a liquidity driver during periods of market stress, and their activity aligns with recent downside moves.

LINK Price Struggles Near $8.60 as Reserves Grow and ETF Inflows Diverge From Market Weakness

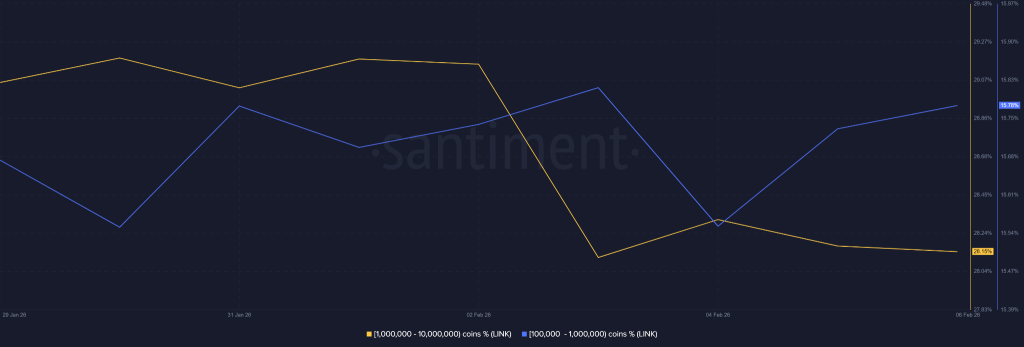
Conversely, wallets holding 100,000 to 1 million LINK continue to accumulate. This divergence suggests a transfer of supply from larger entities to mid-sized holders rather than broad capitulation. Still, until selling from the upper bracket cools, downward pressure on LINK crypto markets may persist.

Technical Zones and Risk Framing

From a technical perspective, analysts continue to closely monitor lower channel supports. If demand weakens further, $5 appears as a historically relevant zone where price compression previously stabilized. A deeper downside scenario places attention on the $1.20 region, which aligns with long-term cycle extremes rather than base expectations.

Still, the LINK price analysis suggests that these levels on chart function more as stress-test markers than forecasts. With the LINK price already down materially from cycle highs, further declines would likely require sustained macro deterioration and continued whale distribution.

Market Opportunity
NEAR Logo
NEAR Price(NEAR)
$1.04
$1.04$1.04
-1.60%
USD
NEAR (NEAR) Live Price Chart
Disclaimer: The articles reposted on this site are sourced from public platforms and are provided for informational purposes only. They do not necessarily reflect the views of MEXC. All rights remain with the original authors. If you believe any content infringes on third-party rights, please contact service@support.mexc.com for removal. MEXC makes no guarantees regarding the accuracy, completeness, or timeliness of the content and is not responsible for any actions taken based on the information provided. The content does not constitute financial, legal, or other professional advice, nor should it be considered a recommendation or endorsement by MEXC.

You May Also Like

Ethereum unveils roadmap focusing on scaling, interoperability, and security at Japan Dev Conference

Ethereum unveils roadmap focusing on scaling, interoperability, and security at Japan Dev Conference

The post Ethereum unveils roadmap focusing on scaling, interoperability, and security at Japan Dev Conference appeared on BitcoinEthereumNews.com. Key Takeaways Ethereum’s new roadmap was presented by Vitalik Buterin at the Japan Dev Conference. Short-term priorities include Layer 1 scaling and raising gas limits to enhance transaction throughput. Vitalik Buterin presented Ethereum’s development roadmap at the Japan Dev Conference today, outlining the blockchain platform’s priorities across multiple timeframes. The short-term goals focus on scaling solutions and increasing Layer 1 gas limits to improve transaction capacity. Mid-term objectives target enhanced cross-Layer 2 interoperability and faster network responsiveness to create a more seamless user experience across different scaling solutions. The long-term vision emphasizes building a secure, simple, quantum-resistant, and formally verified minimalist Ethereum network. This approach aims to future-proof the platform against emerging technological threats while maintaining its core functionality. The roadmap presentation comes as Ethereum continues to compete with other blockchain platforms for market share in the smart contract and decentralized application space. Source: https://cryptobriefing.com/ethereum-roadmap-scaling-interoperability-security-japan/
Share
BitcoinEthereumNews2025/09/18 00:25
Microsoft Corp. $MSFT blue box area offers a buying opportunity

Microsoft Corp. $MSFT blue box area offers a buying opportunity

The post Microsoft Corp. $MSFT blue box area offers a buying opportunity appeared on BitcoinEthereumNews.com. In today’s article, we’ll examine the recent performance of Microsoft Corp. ($MSFT) through the lens of Elliott Wave Theory. We’ll review how the rally from the April 07, 2025 low unfolded as a 5-wave impulse followed by a 3-swing correction (ABC) and discuss our forecast for the next move. Let’s dive into the structure and expectations for this stock. Five wave impulse structure + ABC + WXY correction $MSFT 8H Elliott Wave chart 9.04.2025 In the 8-hour Elliott Wave count from Sep 04, 2025, we saw that $MSFT completed a 5-wave impulsive cycle at red III. As expected, this initial wave prompted a pullback. We anticipated this pullback to unfold in 3 swings and find buyers in the equal legs area between $497.02 and $471.06 This setup aligns with a typical Elliott Wave correction pattern (ABC), in which the market pauses briefly before resuming its primary trend. $MSFT 8H Elliott Wave chart 7.14.2025 The update, 10 days later, shows the stock finding support from the equal legs area as predicted allowing traders to get risk free. The stock is expected to bounce towards 525 – 532 before deciding if the bounce is a connector or the next leg higher. A break into new ATHs will confirm the latter and can see it trade higher towards 570 – 593 area. Until then, traders should get risk free and protect their capital in case of a WXY double correction. Conclusion In conclusion, our Elliott Wave analysis of Microsoft Corp. ($MSFT) suggested that it remains supported against April 07, 2025 lows and bounce from the blue box area. In the meantime, keep an eye out for any corrective pullbacks that may offer entry opportunities. By applying Elliott Wave Theory, traders can better anticipate the structure of upcoming moves and enhance risk management in volatile markets. Source: https://www.fxstreet.com/news/microsoft-corp-msft-blue-box-area-offers-a-buying-opportunity-202509171323
Share
BitcoinEthereumNews2025/09/18 03:50
SHIB Price Analysis for February 8

SHIB Price Analysis for February 8

The post SHIB Price Analysis for February 8 appeared on BitcoinEthereumNews.com. Original U.Today article Can traders expect SHIB to test the $0.0000070 range soon
Share
BitcoinEthereumNews2026/02/09 00:26