Bitcoin price eyes rebound from oversold RSI as spot BTC ETFs see first net inflows in 5 days
Bitcoin price edged higher on Feb. 3 after days of heavy selling, as pressure from forced liquidations faded and fresh capital returned to U.S. spot Bitcoin exchange-traded funds.
- Bitcoin rebounded after dipping to its lowest levels since April 2025.
- Spot Bitcoin ETFs recorded their first net inflows in five sessions.
- Technical indicators suggest short-term relief, not a confirmed reversal.
Bitcoin was trading at $78,659 at the time of writing, up 3.8% from the previous day. The move comes after a severe decline that dragged prices to around $75,400, levels not seen since April 2025.
Even with the bounce, Bitcoin (BTC) is still under strain. The asset is down roughly 11% over the past week and nearly 40% from its October 2025 peak of $126,080, showing how deep the recent correction has been.
Futures market suggests conditions are starting to stabilize. As per CoinGlass data, total trading volume slipped 18.7% to $78.9 billion, while open interest climbed slightly to $52.19 billion. The combination points to traders reopening positions cautiously rather than piling into leverage.
ETF inflows return as dip buyers step in
One of the more constructive signals came from the U.S. spot Bitcoin ETF market. According to data from SoSoValue, spot Bitcoin ETFs recorded net inflows of $561.89 million on Feb. 3, snapping a five-day streak of outflows.
BlackRock’s IBIT led the inflows with $141.99 million, followed by Fidelity’s FBTC at $153.35 million and Bitwise’s BITB with $96.5 million. All other issuers also posted net inflows on the day.
ETF inflows matter because they reflect direct buying of Bitcoin rather than short-term speculation. When these products see steady demand, they can help soak up supply during periods of market stress. While one session does not confirm a trend, the timing suggests institutions are starting to view current prices as attractive.
Some analysts say the setup favors short-term buyers. In a Feb. 3 analysis, CryptoQuant contributor CryptoNiel noted that Bitcoin funding rates have stayed negative for three days in a row, a pattern often seen when short positions dominate futures markets.
“When price declines and funding rates stay negative for several days, it typically signals that short positions are dominating,” he said. “From a bullish perspective, this can represent an attractive entry. From a bearish one, it may also signal the start of a prolonged consolidation phase.”
CryptoNiel added that Bitcoin has failed to push back toward the CME gap near $84,000, suggesting upside momentum is still limited.
Bitcoin price technical analysis
On the technical side, Bitcoin is flashing signs of exhaustion after the recent sell-off, though sellers continue to dictate direction. Bitcoin is clearly in oversold territory as the relative strength index has fallen below 30.
Similar readings have often preceded brief recoveries in previous cycles, even when the overall trend remained negative.
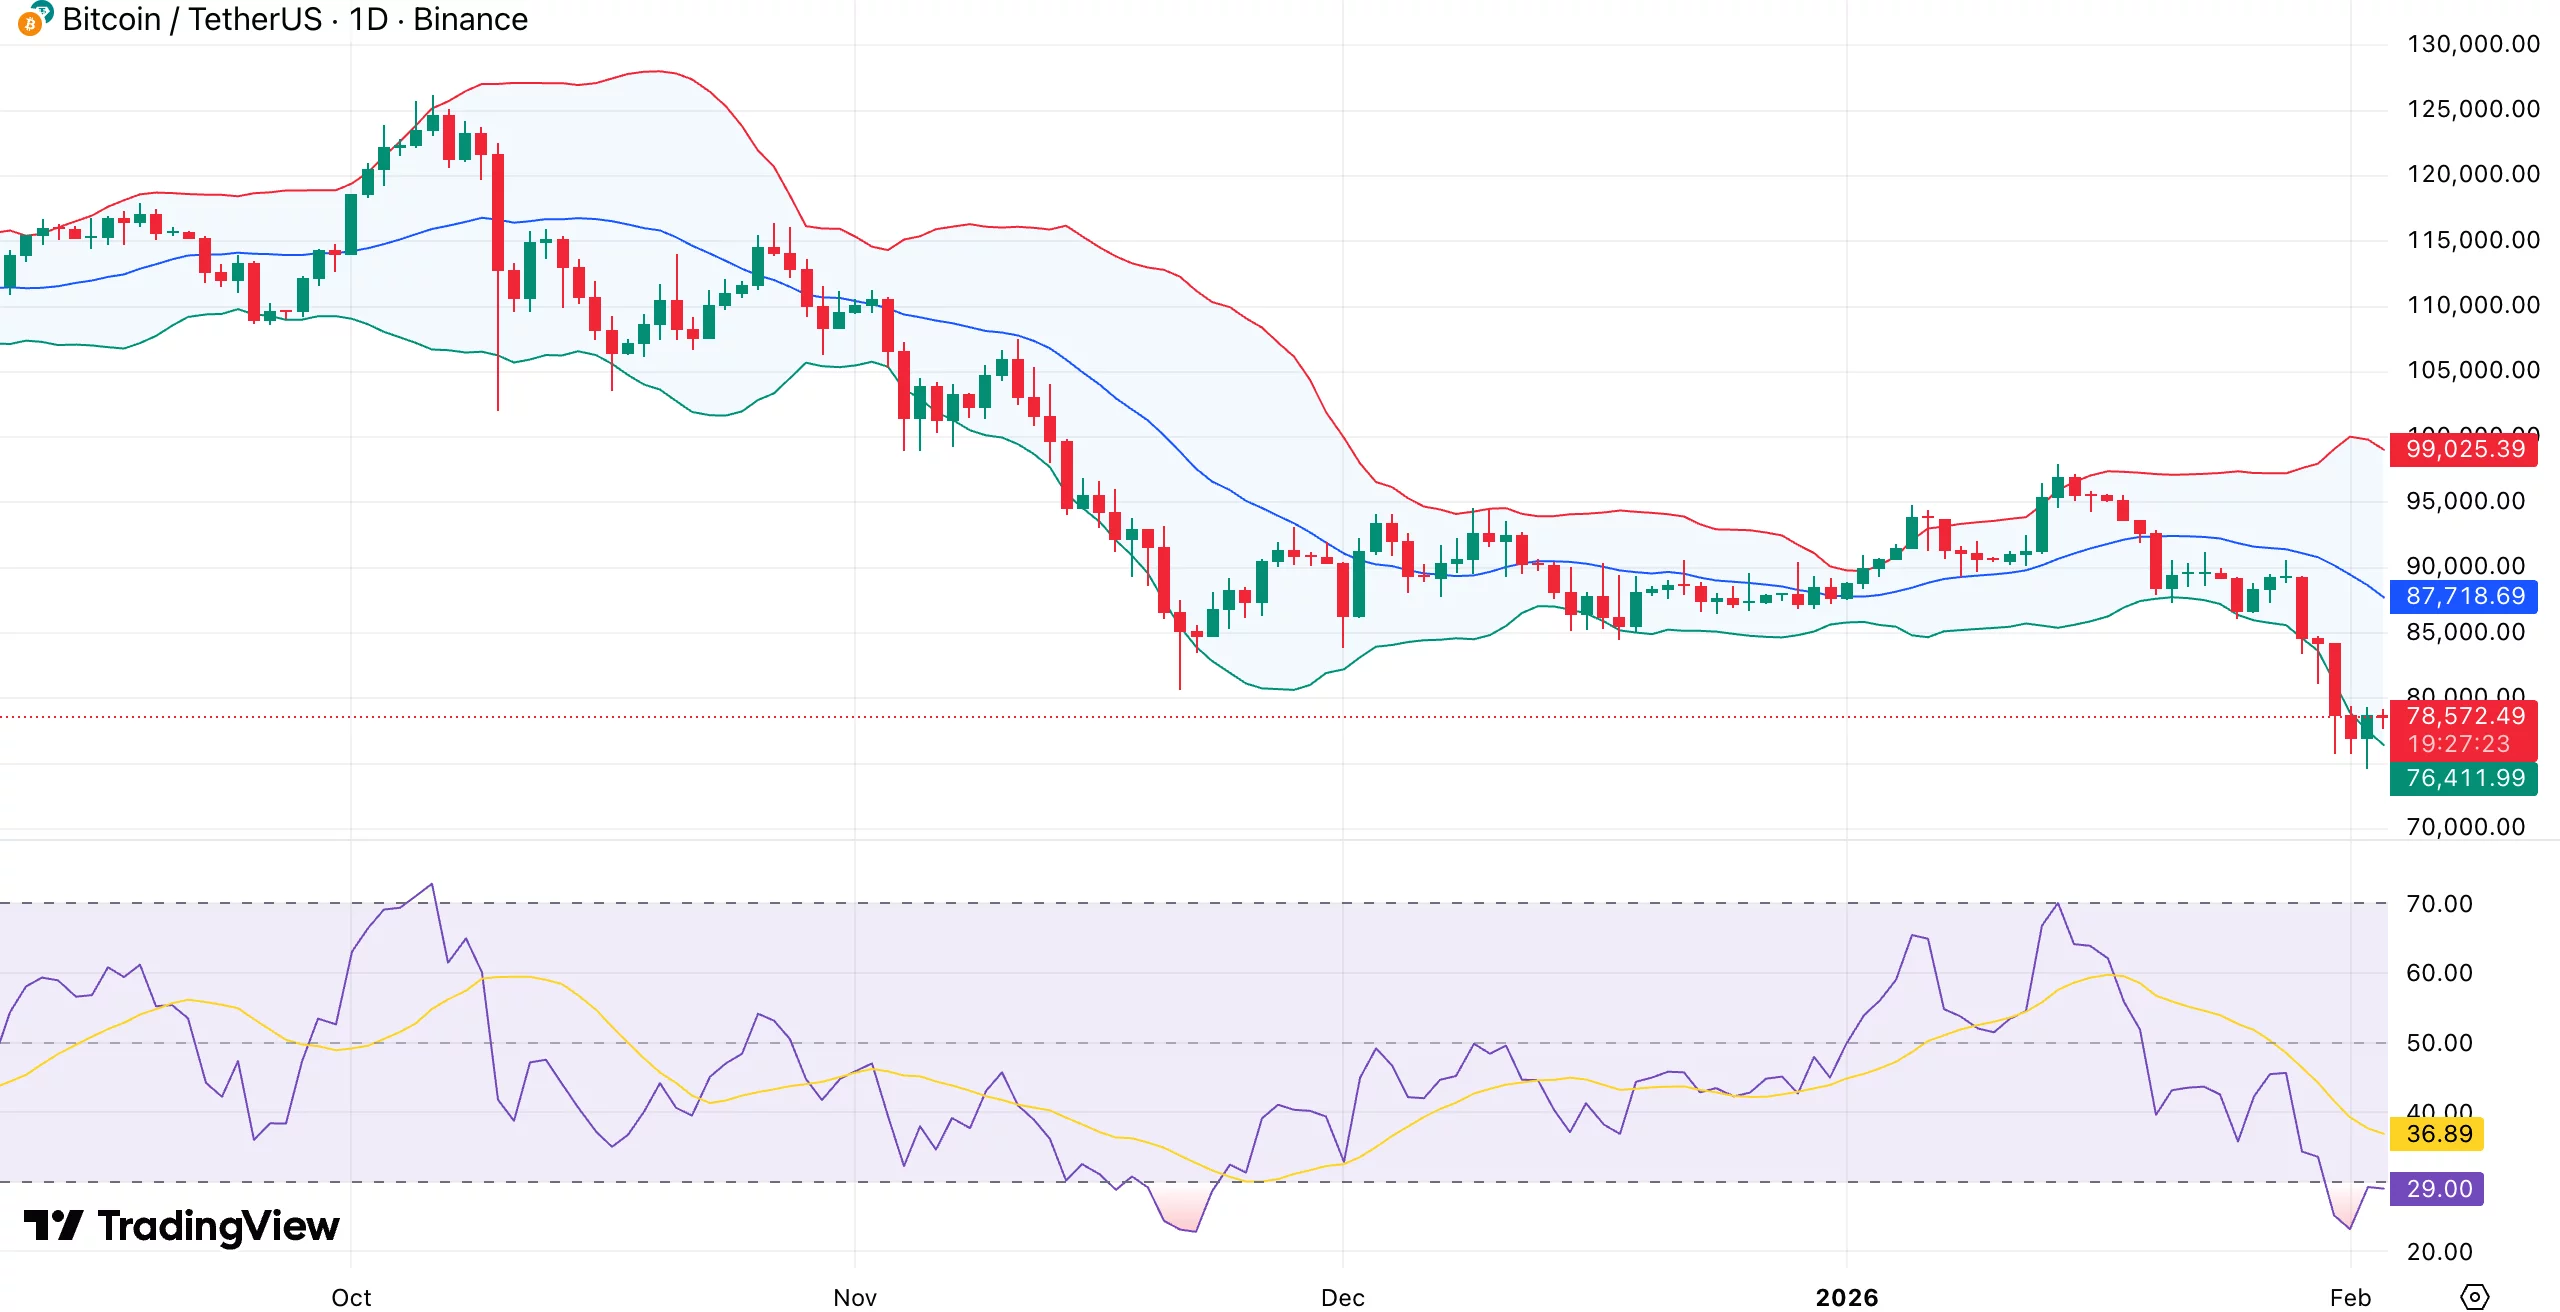
Strong downward pressure is evident in Bitcoin’s trading along the lower Bollinger Band. If selling slows, this setup may precede a return to the mid-band, but a reversal is not guaranteed.
Price remains below both the 20-day and 50-day moving averages, meaning any recovery attempt is likely to face resistance near the $82,000–$85,000 area. That zone previously acted as support before breaking down.
Structurally, the chart continues to show lower highs and lower lows. Bitcoin is currently holding just above the $76,000–$78,000 demand area, where buyers have stepped in before. The market may suffer greater losses if there is a clear break below that range.
However, downward momentum is starting to level off, increasing the likelihood of a bullish RSI divergence should selling pressure continue to wane. In addition, Bollinger Bands are beginning to narrow after rapidly expanding, suggesting that the market may be shifting from aggressive selling to a period of consolidation.


You May Also Like

Bitcoin ETFs Surge with 20,685 BTC Inflows, Marking Strongest Week

USD/JPY Stalls: Critical US Jobs Report Looms as Intervention Fears Intensify