

Chainlink (LINK) at a Make-or-Break Zone: Which Side Wins the $15 vs $10 Battle?
- Chainlink’s price is holding at $12.
- LINK’s trading volume is up by over 28%.
Bears have tightened their grip within the crypto market, and the digital assets sink deeper into the red. The bear’s grip is pulling all major assets down, including dominant names Bitcoin (BTC) and Ethereum (ETH). The largest assets have slipped toward recent lows, trading at $88.9K and $2.9K, respectively.
Among the altcoins, Chainlink (LINK) has dropped 2.05% in the past 24 hours. In the morning hours, the asset traded at a high range of $12.56. Gradually, with the bearish pressure, the LINK market shook and retraced to a low level of $12.10. At press time, Chainlink traded at $12.29.
With the asset’s market cap reaching $8.7 billion, the daily trading volume has increased by over 28.27%, and likely reached the $424.44 million mark. The Coinglass data has reported that the market has experienced an event of liquidation of $2.18 million worth of LINK during this interval.
LINK’s current bearish movement might push its price down, triggering a test of the $12.24 support. Upon the asset failing to hold this range, the death cross could emerge, taking the price toward $12.19 or even lower. Conversely, if the asset enters the bullish zone, the Chainlink price could immediately move up to the resistance at around $12.34. With a steady and clear upside correction, the death cross may unfold, sending the price to $12.39.
Chainlink Charts Point to Bearish Momentum
The Moving Average Convergence Divergence line and signal line of Chainlink are both below the zero line, indicating bearish momentum. Notably, any bounce in this scenario is commonly short-lived unless the MACD moves back above zero.
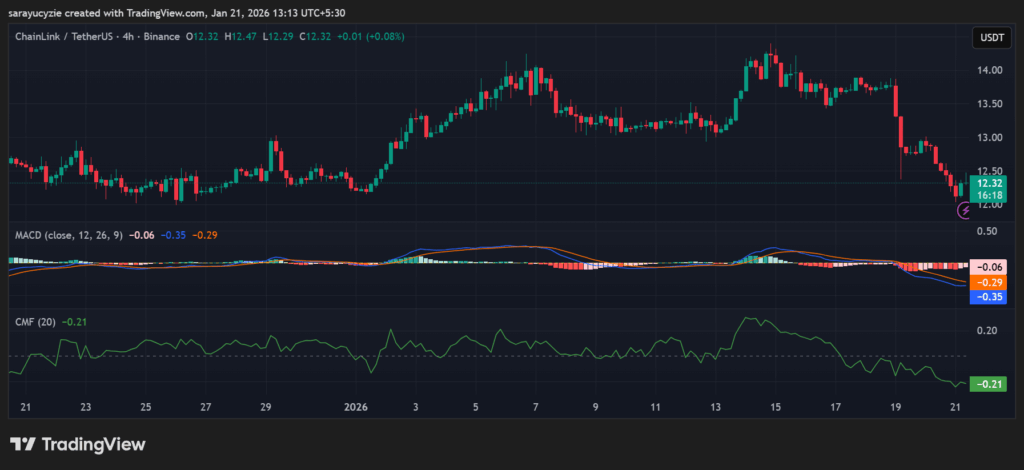 LINK chart (Source: TradingView)
Besides, the Chaikin Money Flow (CMF) indicator value at -0.21 suggests strong selling pressure in the LINK market. The money is flowing out of the asset, reflecting distribution over accumulation, and if this persists, the downtrend will continue.
Chainlink’s active market sentiment is oversold, with the daily Relative Strength Index (RSI) staying at 29.36. Also, the selling pressure has been intense; a short-term bounce may occur. Moreover, the Bull Bear Power (BBP) value of LINK at -0.45 displays bearish dominance. Notably, if the reading remains negative, it is likely to trigger the momentum toward more downside.
Top Updated Crypto News
Bitcoin Cash (BCH) in Tug-of-War Mode: Where Does the Price Go From Here?


You May Also Like

XRP Has Overtaken Solana And Ethereum In This Major Metric

Q2 Market Insights: Bitcoin regains dominance in risk-averse environment, ETFs remain critical to market structure

What’s new in House Kalinga bill to cushion oil price shock?


