

XRP Price Prediction: Is XRP Building Toward $8–$27 Based on Fibonacci and Wyckoff Analysis?
Despite recent consolidation near $2.14, multiple indicators, including Fibonacci extensions and Wyckoff accumulation patterns, suggest XRP could be preparing for a measured upward move, contingent on sustained volume and confirmed breakout levels.
XRP Price Consolidation Above Key Technical Levels
As of January 14, 2026, XRP is trading near $2.14, slightly above recent resistance at $2.12–$2.17 on elevated volume. While this move may suggest early bullish momentum, XRP remains within a well-defined one-year range of $1.80–$2.30.
XRP/USD nears key resistance; a breakout with volume could signal bullish continuation, but false moves are possible. Source: HoneySpotTrading on TradingView
Analysts note that range-bound trading reflects broader market conditions, regulatory developments, and institutional accumulation, rather than a guaranteed breakout.
Fibonacci Extensions as Conditional Long-Term Targets
Technical analysis using Fibonacci extensions from historical symmetrical triangle patterns (dating back to 2014) suggests the following potential targets, provided XRP achieves sustained breakout conditions:
- 1.272 extension near $8
- 1.414 extension around $15
- 1.618 extension close to $27
The post analyzes XRP/USD using Fibonacci extensions from a long-term symmetrical triangle, highlighting potential upside targets of $8–$27 contingent on a breakout above $2.71, amid mixed market sentiment. Source: ChartNerd via X
These levels are derived from a measured move methodology, where the size of prior consolidation patterns is projected outward. Analysts stress that these are long-term projections. not short-term price predictions. XRP would need to break key resistance levels and maintain volume to approach these extensions. Failure to hold support near $1.80 could invalidate the scenario.
Wyckoff Accumulation Explains the Range-Bound Structure
XRP’s sideways trading may also reflect Wyckoff accumulation, a theory describing strategic accumulation by professional buyers before a major trend. Key features currently observed in XRP include:
- Muted price volatility
- Mixed sentiment among retail traders
- Rising volume in specific pullback phases
Wyckoff cycles show how smart money drives markets through accumulation, markup, distribution, and markdown phases. Source: Finance_Lozha on TradingView
Market educators note that such accumulation often precedes expansion, but the timing can be uncertain, and a failed breakout could lead to extended range-bound behavior rather than an immediate rally.
To provide clarity:
- Short-term momentum trades may target small breakouts above $2.17–$2.30, contingent on volume confirmation.
- Long-term cycle scenarios consider potential XRP retracements or consolidation phases if broader crypto conditions or liquidity trends shift.
This multi-timeframe approach ensures readers understand that near-term bullish signals do not guarantee long-term outcomes.
Key Support and Resistance Levels
- Support: $1.80, reinforced by repeated buying interest on pullbacks
- Immediate resistance: $2.17–$2.30
- Conditional targets: $8, $15, $27 (Fibonacci projections, valid only if resistance is broken with volume)
Scenario guidance:
- Break and hold above $2.30 → potential momentum continuation
- Failure to sustain above $2.12 → continued range trading or reassessment of longer-term accumulation
Market Context and Sentiment
XRP has gained approximately 16% year-to-date, outperforming several large-cap peers. Analysts advise interpreting technical patterns alongside regulatory clarity, institutional adoption, and broader market liquidity, rather than relying solely on charts.
XRP was trading at around 2.092, down 3.74% in the last 24 hours at press time. Source: XRP price via Brave New Coin
Multiple analysts and market educators contribute to these perspectives, reducing dependence on a single source and reinforcing editorial judgment.
Final Thoughts:
While Fibonacci and Wyckoff patterns provide a structured framework for understanding XRP’s potential, all projections remain conditional. XRP is currently in a preparatory phase characterized by price compression, accumulation, and mixed sentiment.
A confirmed breakout above resistance, accompanied by strong volume, would be a key signal for potential upward momentum. Conversely, failure to maintain support may keep XRP range-bound or lead to extended consolidation.
Traders and long-term observers should monitor key technical levels, maintain a multi-timeframe perspective, and view all price projections as scenarios rather than certainties.


You May Also Like
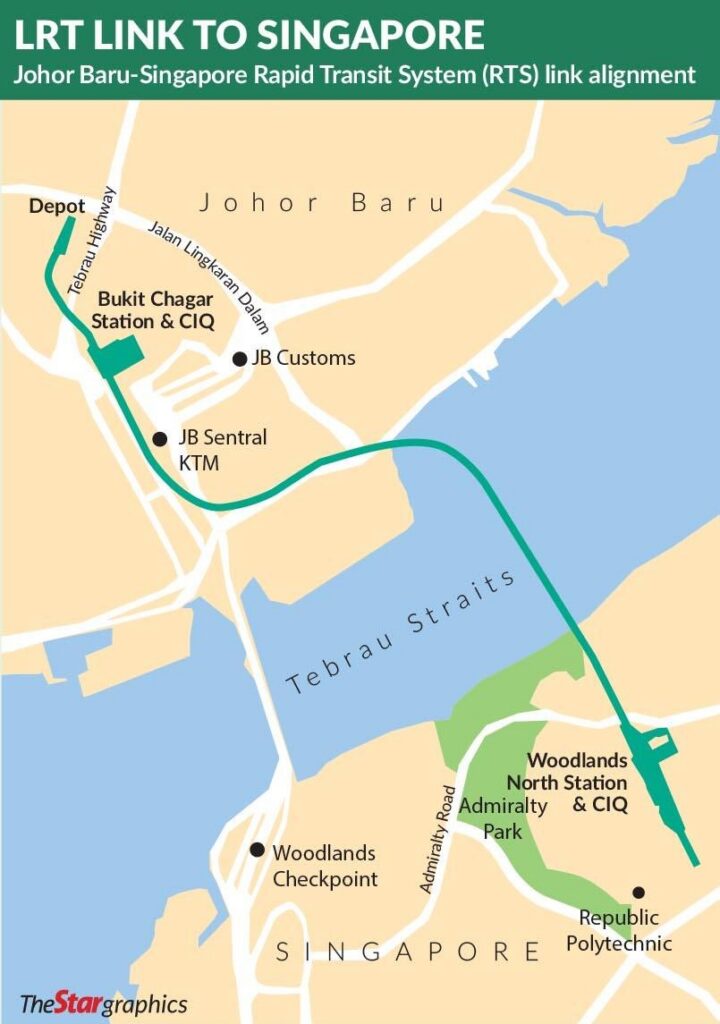
RTS Link Singapore–JB (2026): Fares, Stations & Opening

Sterling Weakens As Dollar Soars On Geopolitical Escalation And Bailey’s Cautious Stance


