

Ripple’s XRP (XRP) Price: Dip Buying Hits Four-Month High During 15% Weekly Drop
TLDR
- XRP dropped 15% in six days but saw the strongest dip buying since September 7, 2025, with holders accumulating 480 million XRP over two days.
- Price is testing the 20-day EMA near $2.04, which acted as a trigger for a 15% drop in early December when it broke.
- Two major supply clusters sit at $2.01 (1.9 billion XRP) and $1.97 (1.8 billion XRP), explaining buyer conviction at current levels.
- Small whales holding 1-10 million XRP added $20.5 million worth, but larger whales remain on the sidelines.
- XRP trades at $2.06-$2.07 with institutional interest in Ripple’s network growing as BlackRock reportedly uses RLUSD stablecoin.
XRP has fallen nearly 15% since January 6, dropping from its peak and breaking through multiple support levels over six days. The price peaked on January 6 but failed to reclaim its 200-day exponential moving average.
 XRP Price
An exponential moving average gives more weight to recent prices and helps traders identify trend strength. When price stays below key EMAs, sellers typically remain in control.
The coin first lost the 100-day EMA, then the 50-day EMA. It now sits near the 20-day EMA around $2.04, which has become the last short-term trend support.
This level matters because it often separates controlled pullbacks from deeper slides. In early December, XRP lost the 20-day EMA on December 4 and dropped roughly 15% in the following days.
A daily close below this level could trigger another leg down. The next support zones sit at $2.01 and $1.97.
Record Dip Buying Emerges
Despite the technical damage, long-term holders are accumulating at the fastest pace in four months. The HODLer net position change tracks whether long-term wallets are increasing or decreasing their coin balances.
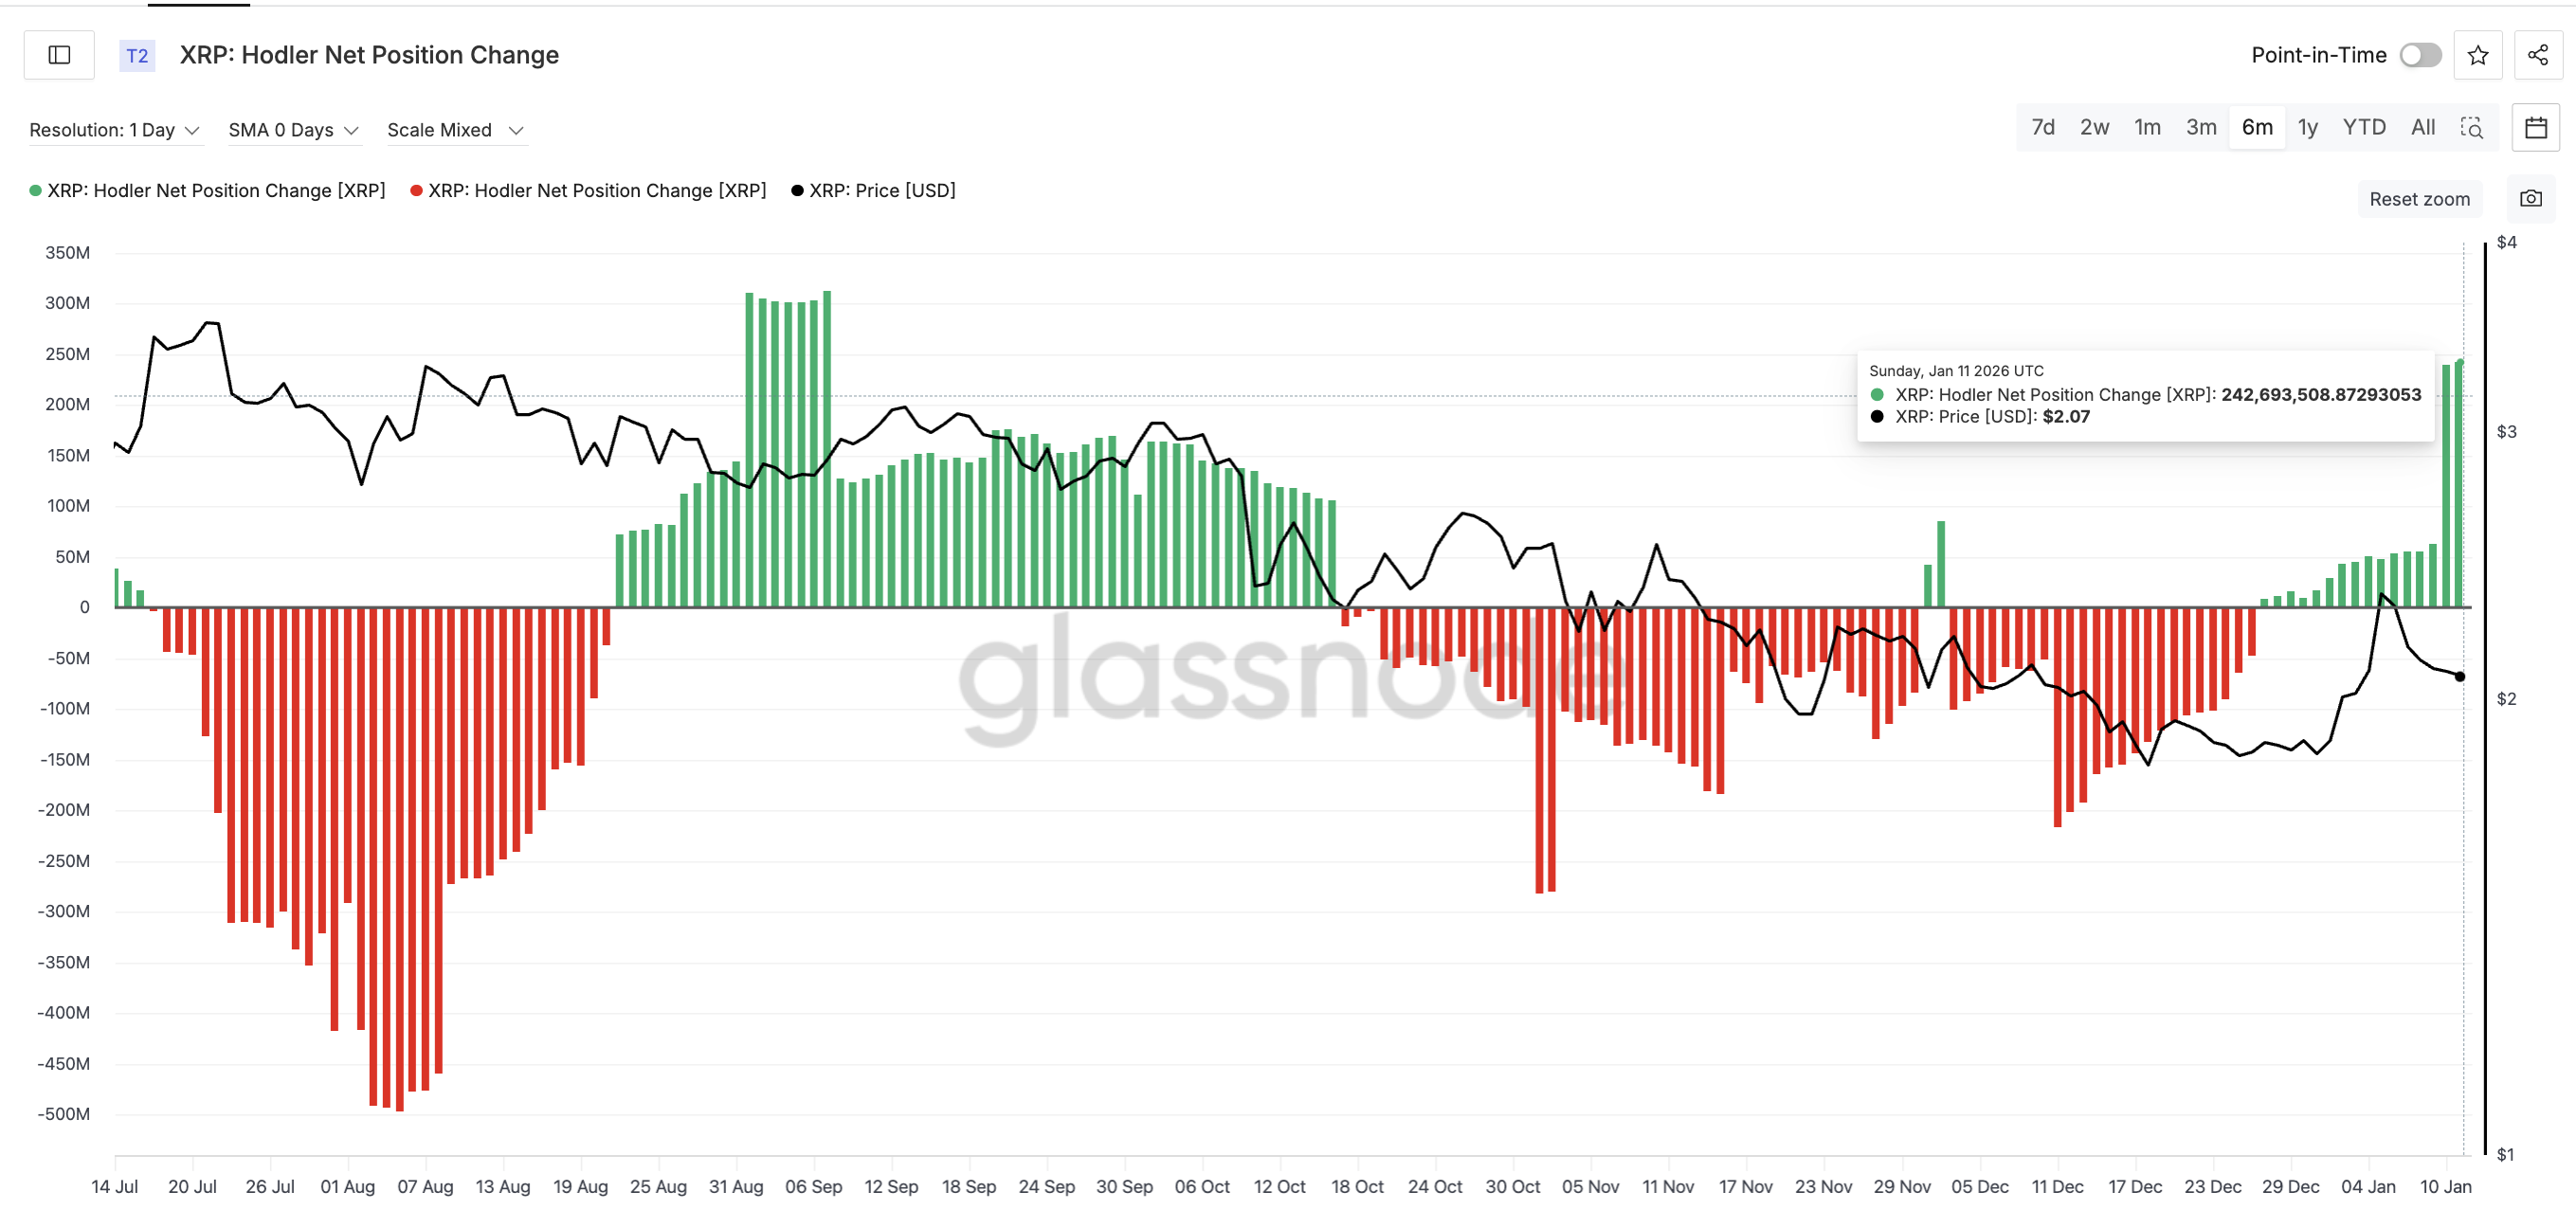 Source: Glassnode
Holders added roughly 62 million XRP on January 9. On January 10 and 11, they absorbed around 239 million XRP and 243 million XRP respectively, even as the price continued falling.
This marks the strongest two-day dip-buying streak since September 7, 2025. The total accumulation over these two days reached approximately 480 million XRP.
Smaller whales holding between 1 million and 10 million XRP also showed activity. Their combined balances rose from 3.52 billion to 3.53 billion XRP, an increase of about 10 million coins worth roughly $20.5 million at current prices.
Larger whales remain cautious and have not joined the buying. This creates targeted defensive buying rather than broad accumulation across all holder groups.
The conviction comes from XRP’s cost-basis structure. Supply clusters form where large amounts of coins were bought at similar prices.
Two major clusters sit just below current price. The first lies between $2.00 and $2.01, where roughly 1.9 billion XRP were accumulated. The second sits between $1.96 and $1.97, with another 1.8 billion XRP bought.
These zones often act as defense levels because holders near break-even tend to buy dips rather than sell at a loss. This explains why selling pressure has slowed despite weak momentum.
Momentum indicators show some stabilization. The MACD produced a bullish crossover with a positive histogram on daily charts. The on-balance volume appears to be stabilizing after declining, suggesting intense selling pressure may have eased.
If XRP holds above $2.00, the structure allows for possible movement toward $2.50. A reclaim of the 20-day EMA near $2.04 would signal the defense is working.
On the upside, XRP must reclaim $2.21 and then $2.41, the January 6 peak. Clearing $2.41 would put $2.69 back in play.
Downside risk remains present. A clean break below $2.01 exposes $1.97, followed by $1.77 if that level fails.
Historical Q1 data from Cryptorank shows many past first quarters produced positive price increases for XRP, particularly after periods of consolidation. While past performance does not guarantee future results, the pattern suggests Q1 has often favored buyers when technical conditions aligned.
Recent reports indicate BlackRock uses Ripple’s RLUSD stablecoin for collateral transactions, building institutional confidence in Ripple’s ecosystem. XRP currently trades at $2.06 with a 0.77% decrease over 24 hours.
The post Ripple’s XRP (XRP) Price: Dip Buying Hits Four-Month High During 15% Weekly Drop appeared first on CoinCentral.


You May Also Like

Trump’s Hormuz Ultimatum Sends Oil Past $110, Highest Since March

Iran mediators propose 45-day ceasefire amid low US-Iran resolution odds: FT


