

PANews reported on July 8 that according to DeFi Development Corp. (on the X platform), 60 days ago, the company held 420,690 SOLs , which has now increased to 690,420PANews reported on July 8 that according to DeFi Development Corp. (on the X platform), 60 days ago, the company held 420,690 SOLs , which has now increased to 690,420
DeFi Development purchased 47,272 SOLs, and its holdings increased to 690,000
For feedback or concerns regarding this content, please contact us at crypto.news@mexc.com
PANews reported on July 8 that according to DeFi Development Corp. (on the X platform), 60 days ago, the company held 420,690 SOLs , which has now increased to 690,420 , an increase of 64% . After the company's latest purchase of 47,272 SOLs, the total market value of SOL and equivalent assets is approximately US$103 million. As of July 8, 2025 , the total outstanding shares of DeFi Development Corp. are 17,402,299 shares, corresponding to 0.0397 SOLs per share , equivalent to US$5.90 per share. All newly purchased SOLs have been fully pledged, continuing to obtain native income and helping Solana network security.
Market Opportunity
DeFi Price(DEFI)
$0.0002364
$0.0002364$0.0002364
USD
DeFi (DEFI) Live Price Chart


Disclaimer: The articles reposted on this site are sourced from public platforms and are provided for informational purposes only. They do not necessarily reflect the views of MEXC. All rights remain with the original authors. If you believe any content infringes on third-party rights, please contact crypto.news@mexc.com for removal. MEXC makes no guarantees regarding the accuracy, completeness, or timeliness of the content and is not responsible for any actions taken based on the information provided. The content does not constitute financial, legal, or other professional advice, nor should it be considered a recommendation or endorsement by MEXC.
You May Also Like
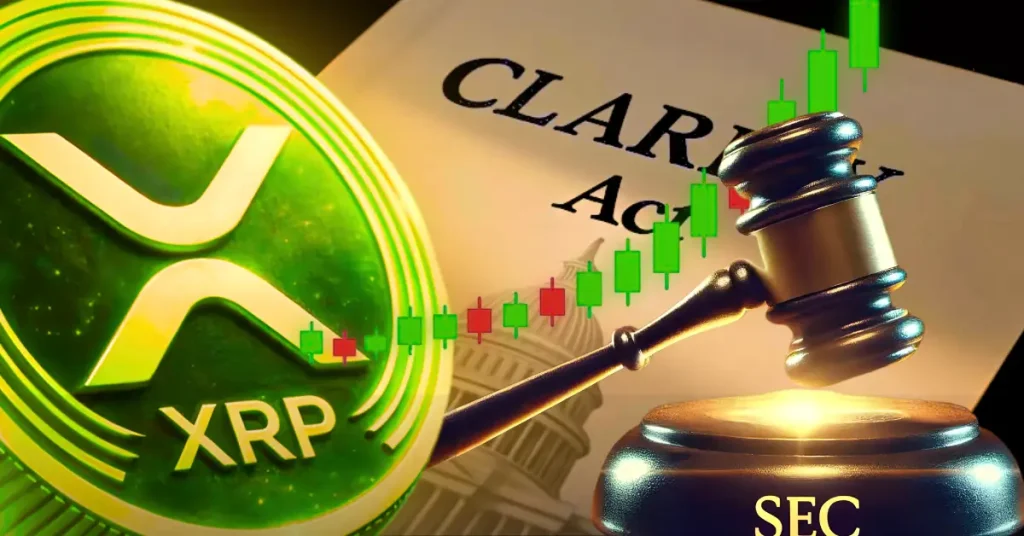
XRP Leads Major Altcoins Higher as CLARITY Act Triggers Payment-Focused Crypto Rally
The post XRP Leads Major Altcoins Higher as CLARITY Act Triggers Payment-Focused Crypto Rally appeared first on Coinpedia Fintech News XRP is showing a clear power
Share
CoinPedia2026/05/15 10:57

Ethereum Price Trapped Below $2,320, Recovery Hopes Start Fading
Ethereum price started a recovery wave above the $2,280 zone. ETH is now consolidating and might struggle to continue higher above the $2,320 resistance. Ethereum
Share
NewsBTC2026/05/15 10:58
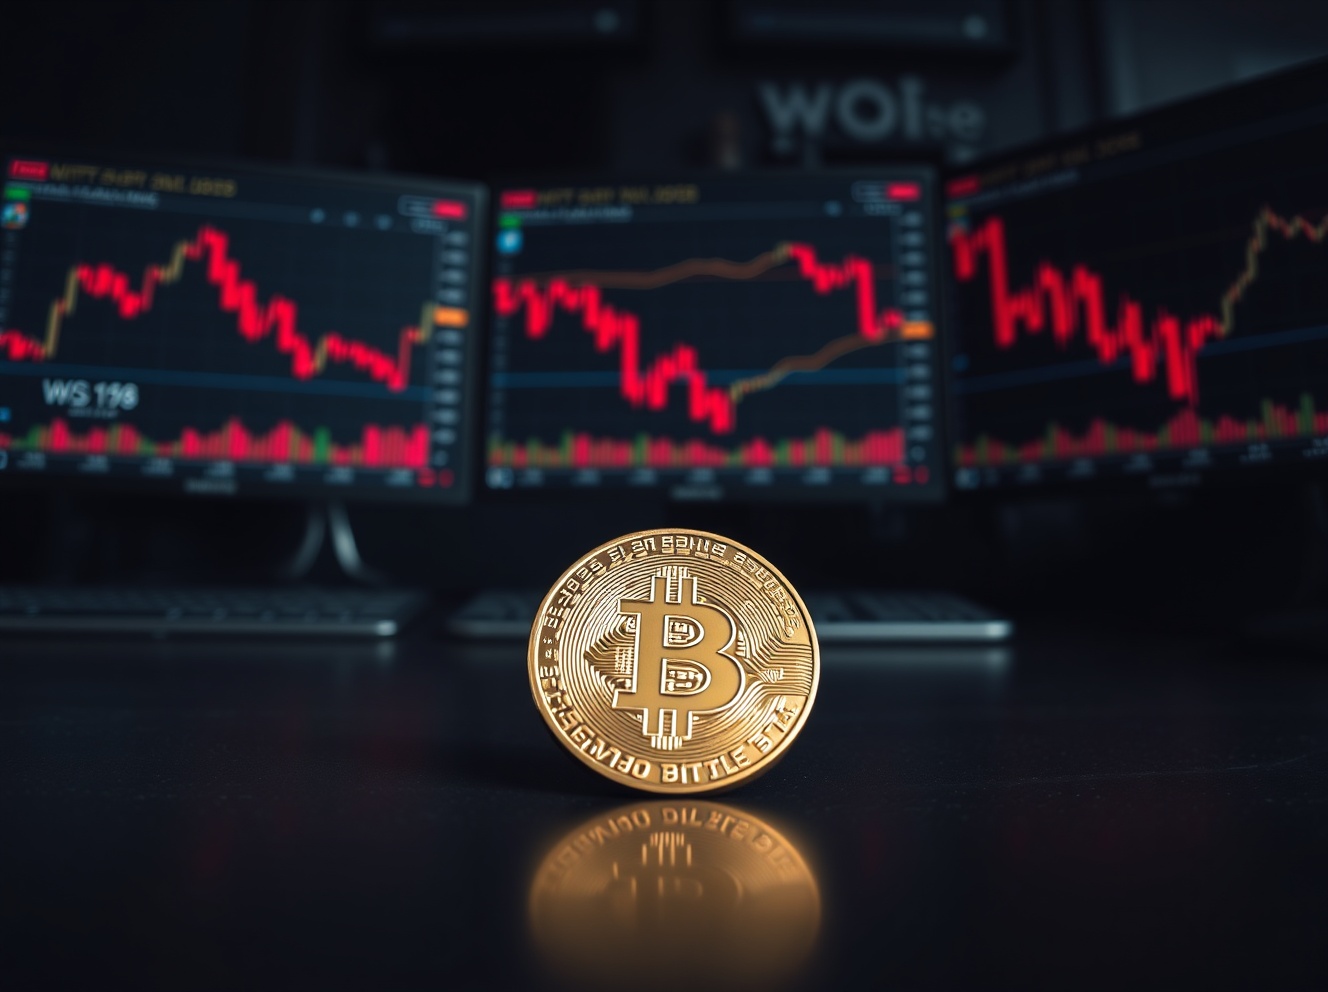
Bitcoin Slides Below $81,000: What’s Driving the Decline?
BitcoinWorld Bitcoin Slides Below $81,000: What’s Driving the Decline? Bitcoin (BTC) has dropped below the $81,000 threshold, extending its recent downward trend
Share
bitcoinworld2026/05/15 10:30


