The second trading day of 2026 opened with a brief green flash, as the crypto market cap spiked 1.24%, landing at around $3 trillion. The majority of the tokensThe second trading day of 2026 opened with a brief green flash, as the crypto market cap spiked 1.24%, landing at around $3 trillion. The majority of the tokens

PEPE Rockets 27%: Is the Momentum Sustainable or a Classic Meme Coin Trap?

  • PEPE is trading at $0.0000051, with a 27% jump. 
  • The trading volume has skyrocketed by over 377%.

The second trading day of 2026 opened with a brief green flash, as the crypto market cap spiked 1.24%, landing at around $3 trillion. The majority of the tokens are seeking to climb higher into the bullish zone. Meanwhile, the meme coin market cap has jumped over 8.20% to $44.20 billion in the past 24 hours. 

PEPE, the frog-themed meme coin, has invited the bulls to take control, posting a steady and solid 27.26% gain. It has taken a break from the prolonged bearish wave in the market. In the early hours, the asset traded at a bottom of $0.000004077, and with the bullish shift, the price has mounted to a high of $0.000005155.

At the time of writing, PEPE traded at the $0.000005136 mark, and its market cap chose to stay at $2.17 billion. Consequently, the meme coin’s daily trading volume has skyrocketed by over 377%, reaching the $819.5 million zone. Furthermore, during this timeframe, the market has witnessed a $3.13 million PEPE liquidation. 

Can PEPE Extend Its Rally From Here?

PEPE’s Moving Average Convergence Divergence (MACD) line has crossed well above the signal line, which indicates that the bullish momentum is building. Also, with this crossover, the price could continue to move higher. In addition, the Chaikin Money Flow (CMF) indicator value found at 0.50 suggests strong buying pressure in the meme coin market. Notably, the capital is flowing into the asset, supporting the bullish price action.

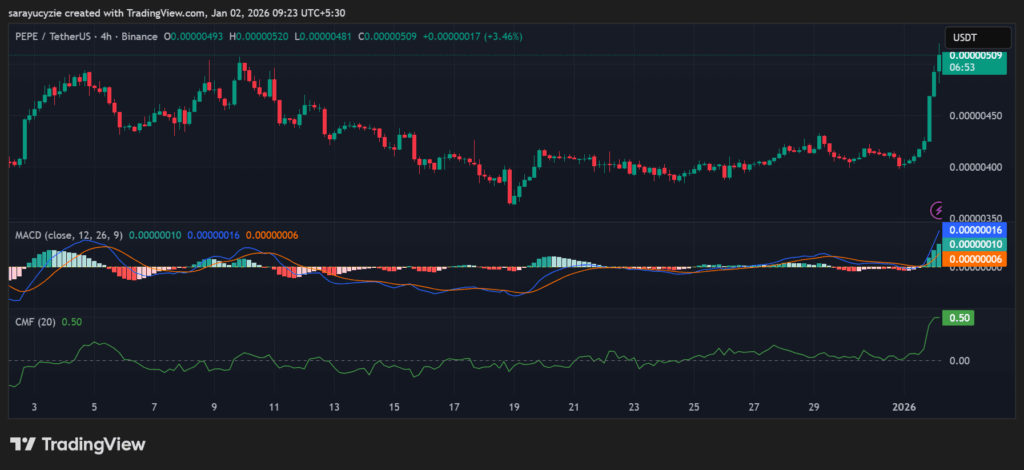
PEPE chart (Source: TradingView)

The 4-hour trading chart exhibits the bullish encounter, with the PEPE price climbing to the crucial resistance level at around $0.000005156. If the upside pressure continued to strengthen, it could initiate the golden cross to take place, and rise toward $0.000005176 or even higher. 

Conversely, in case the ongoing momentum reverses, a bearish run might appear again, and the PEPE price would fall and test its key support at the $0.000005116 range. With the downside correction intensifying, the death cross unfolds, and the price retraces below $0.000005096. 

Moreover, the daily Relative Strength Index (RSI) at 85.90 implies the meme coin’s overbought condition. It has buying momentum in action, but is also due for a short-term pullback or consolidation unless the trend remains strong. As PEPE’s Bull Bear Power (BBP) reading is resting at 0.00000122, the sentiment is slightly on the positive side. Significantly, the market is close to neutral, and the price direction is likely to remain indecisive.

Top Updated Crypto News

Jupiter Launches Mobile V3 With Native Pro Trading Tools

Market Opportunity
Pepe Logo
Pepe Price(PEPE)
$0.000006217
$0.000006217$0.000006217
+12.01%
USD
Pepe (PEPE) Live Price Chart
Disclaimer: The articles reposted on this site are sourced from public platforms and are provided for informational purposes only. They do not necessarily reflect the views of MEXC. All rights remain with the original authors. If you believe any content infringes on third-party rights, please contact service@support.mexc.com for removal. MEXC makes no guarantees regarding the accuracy, completeness, or timeliness of the content and is not responsible for any actions taken based on the information provided. The content does not constitute financial, legal, or other professional advice, nor should it be considered a recommendation or endorsement by MEXC.

You May Also Like

Coinbase To List Singaporean Dollar Stablecoin For Trading

Coinbase To List Singaporean Dollar Stablecoin For Trading

Coinbase and StraitsX launch XSGD on Base, offering 1:1 SGD conversion, MAS approval, and new DeFi use cases for Singapore’s market.   Coinbase and StraitsX have partnered to launch XSGD, a stablecoin backed by the Singapore dollar.  The rollout shows Coinbase’s push into the Asia-Pacific market and introduces one of the few non-USD stablecoins with […] The post Coinbase To List Singaporean Dollar Stablecoin For Trading appeared first on Live Bitcoin News.
Share
LiveBitcoinNews2025/09/25 16:30
Why Is Shiba Inu (SHIB) Price Pumping Today?

Why Is Shiba Inu (SHIB) Price Pumping Today?

Shiba Inu is back in focus after a sharp move higher that surprised a lot of traders. After days of going nowhere, SHIB suddenly caught a bid, with volume picking
Share
Coinstats2026/01/03 06:30
Bitcoin (BTC) Price Prediction for September 27

Bitcoin (BTC) Price Prediction for September 27

The post Bitcoin (BTC) Price Prediction for September 27 appeared on BitcoinEthereumNews.com. Bulls are dominating over bears on the first day of the weekend, according to CoinStats. Top coins by CoinStats BTC/USD Unlike other coins, the price of Bitcoin (BTC) has declined by 0.11% over the last 24 hours. Image by TradingView On the hourly chart, the rate of BTC has made a false breakout of the local support of $109,255. However, if a bounce back does not happen, the fall is likely to continue to the $109,000 area by tomorrow. Image by TradingView On the bigger time frame, the situation is less clear. The price of the main crypto is within yesterday’s bar, which means neither side is dominating. You Might Also Like In this case, consolidation in the area of $109,000-$110,000 is the more likely scenario over the next days. Image by TradingView From the midterm point of view, the rate of BTC keeps going down after a false breakout of the resistance of $117,622. If the drop continues to the support of $107,389, one can expect a test of the $105,000 zone soon. Bitcoin is trading at $109,352 at press time. Source: https://u.today/bitcoin-btc-price-prediction-for-september-27-0
Share
BitcoinEthereumNews2025/09/27 18:53