The post AI Tokens Are Dominating Crypto Markets—But Here’s What the Data Is Really Showing appeared first on Coinpedia Fintech News As Bitcoin continues to consolidateThe post AI Tokens Are Dominating Crypto Markets—But Here’s What the Data Is Really Showing appeared first on Coinpedia Fintech News As Bitcoin continues to consolidate

AI Tokens Are Dominating Crypto Markets—But Here’s What the Data Is Really Showing

2025/12/19 22:17
3 min read
Monad Airdrop Claim Guide

The post AI Tokens Are Dominating Crypto Markets—But Here’s What the Data Is Really Showing appeared first on Coinpedia Fintech News

As Bitcoin continues to consolidate and major altcoins focus on defending key support levels, traders are watching where attention is shifting next. After weeks of liquidation-driven volatility, market activity has slowed, but interest has not disappeared. Instead, it is rotating. AI-linked crypto tokens are now dominating social engagement, even as prices remain range-bound. This contrast matters. 

In past cycles, narratives often regain attention before capital follows. With BTC price stable and broader altcoin momentum muted, tracking where discussion and early participation are building can offer useful clues about potential sector rotation ahead.

What the Charts and On-Chain Data Are Signalling

Price action across AI tokens remains compressed, but on-chain activity adds important context. Wallet activity has stabilised across several large-cap AI projects, with no sharp spikes in exchange inflows. That suggests holders are not rushing to distribute at current levels.

Transaction counts and active addresses have stopped declining, even as price stays range-bound. This often signals participation is holding steady beneath the surface. At the same time, derivatives data show muted open interest growth, confirming that leverage has not yet driven this narrative.

From a trader’s perspective, this combination matters. On-chain data points to engagement without excess, while charts show consolidation rather than expansion. That alignment typically appears before direction resolves, not after it has already played out.

AI Tokens Seeing the Most Trader Attention

The chart highlights where trader attention is concentrating within the AI segment, based on social engagement rather than price performance. Large-cap names dominate the discussion, while mid-cap projects also feature prominently, suggesting interest is spreading beyond a single leader. This kind of engagement clustering often appears when traders are building watchlists, not chasing momentum.
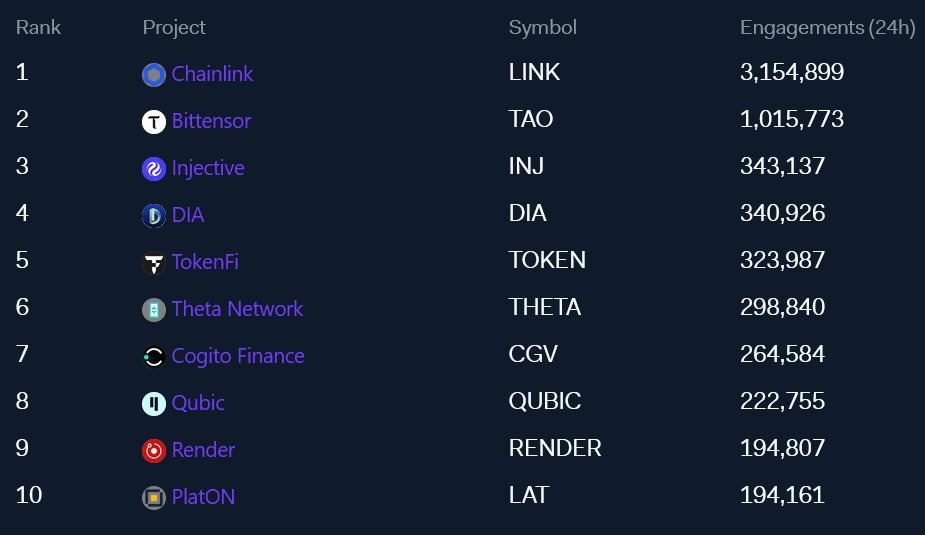
ai tokensSource: X

Importantly, attention is rising without a matching surge in volume or volatility. That tells us participation remains selective. Traders are tracking these names for confirmation, waiting for structure breaks or volume expansion before committing capital. In this phase, engagement acts as an early signal of focus, not a trigger for immediate execution.

How Traders Need to Interpret This Phase

This phase tells traders to stay patient, not passive. AI tokens are attracting attention, but price action remains controlled. That usually signals preparation rather than execution. Traders should expect continued consolidation unless volume expands and key resistance levels break. Until then, social engagement should be read as early positioning interest, not confirmation of a trend.

The takeaway is simple. Watch how price reacts when broader altcoin momentum returns. Sectors that hold structure while attention builds often move first once conditions turn supportive. For now, this phase is about observation, refining levels, and waiting for confirmation rather than chasing narratives.

Market Opportunity
null Logo
null Price(null)
--
----
USD
null (null) Live Price Chart
Disclaimer: The articles reposted on this site are sourced from public platforms and are provided for informational purposes only. They do not necessarily reflect the views of MEXC. All rights remain with the original authors. If you believe any content infringes on third-party rights, please contact service@support.mexc.com for removal. MEXC makes no guarantees regarding the accuracy, completeness, or timeliness of the content and is not responsible for any actions taken based on the information provided. The content does not constitute financial, legal, or other professional advice, nor should it be considered a recommendation or endorsement by MEXC.

You May Also Like

Microsoft Corp. $MSFT blue box area offers a buying opportunity

Microsoft Corp. $MSFT blue box area offers a buying opportunity

The post Microsoft Corp. $MSFT blue box area offers a buying opportunity appeared on BitcoinEthereumNews.com. In today’s article, we’ll examine the recent performance of Microsoft Corp. ($MSFT) through the lens of Elliott Wave Theory. We’ll review how the rally from the April 07, 2025 low unfolded as a 5-wave impulse followed by a 3-swing correction (ABC) and discuss our forecast for the next move. Let’s dive into the structure and expectations for this stock. Five wave impulse structure + ABC + WXY correction $MSFT 8H Elliott Wave chart 9.04.2025 In the 8-hour Elliott Wave count from Sep 04, 2025, we saw that $MSFT completed a 5-wave impulsive cycle at red III. As expected, this initial wave prompted a pullback. We anticipated this pullback to unfold in 3 swings and find buyers in the equal legs area between $497.02 and $471.06 This setup aligns with a typical Elliott Wave correction pattern (ABC), in which the market pauses briefly before resuming its primary trend. $MSFT 8H Elliott Wave chart 7.14.2025 The update, 10 days later, shows the stock finding support from the equal legs area as predicted allowing traders to get risk free. The stock is expected to bounce towards 525 – 532 before deciding if the bounce is a connector or the next leg higher. A break into new ATHs will confirm the latter and can see it trade higher towards 570 – 593 area. Until then, traders should get risk free and protect their capital in case of a WXY double correction. Conclusion In conclusion, our Elliott Wave analysis of Microsoft Corp. ($MSFT) suggested that it remains supported against April 07, 2025 lows and bounce from the blue box area. In the meantime, keep an eye out for any corrective pullbacks that may offer entry opportunities. By applying Elliott Wave Theory, traders can better anticipate the structure of upcoming moves and enhance risk management in volatile markets. Source: https://www.fxstreet.com/news/microsoft-corp-msft-blue-box-area-offers-a-buying-opportunity-202509171323
Share
BitcoinEthereumNews2025/09/18 03:50
XRP Buyers Defend Most Major 200-Week Price Average: Can It Be Bottom of 2026?

XRP Buyers Defend Most Major 200-Week Price Average: Can It Be Bottom of 2026?

The post XRP Buyers Defend Most Major 200-Week Price Average: Can It Be Bottom of 2026? appeared on BitcoinEthereumNews.com. XRP has returned to its 200-week moving
Share
BitcoinEthereumNews2026/02/08 19:49
Expert Tags Ethereum’s ERC-8004 Mainnet Launch An “iPhone Moment”, Here’s What It Means

Expert Tags Ethereum’s ERC-8004 Mainnet Launch An “iPhone Moment”, Here’s What It Means

Market analyst says Ethereum is having an “iPhone moment” as it approaches the ERC-8004 mainnet launch.
Share
Coinstats2026/02/08 19:56