

HBAR price targets new yearly low, bearish momentum continues
HBAR price continues to weaken as bearish structure persists, with the loss of key support increasing the probability of a deeper corrective move toward the $0.07 yearly low.
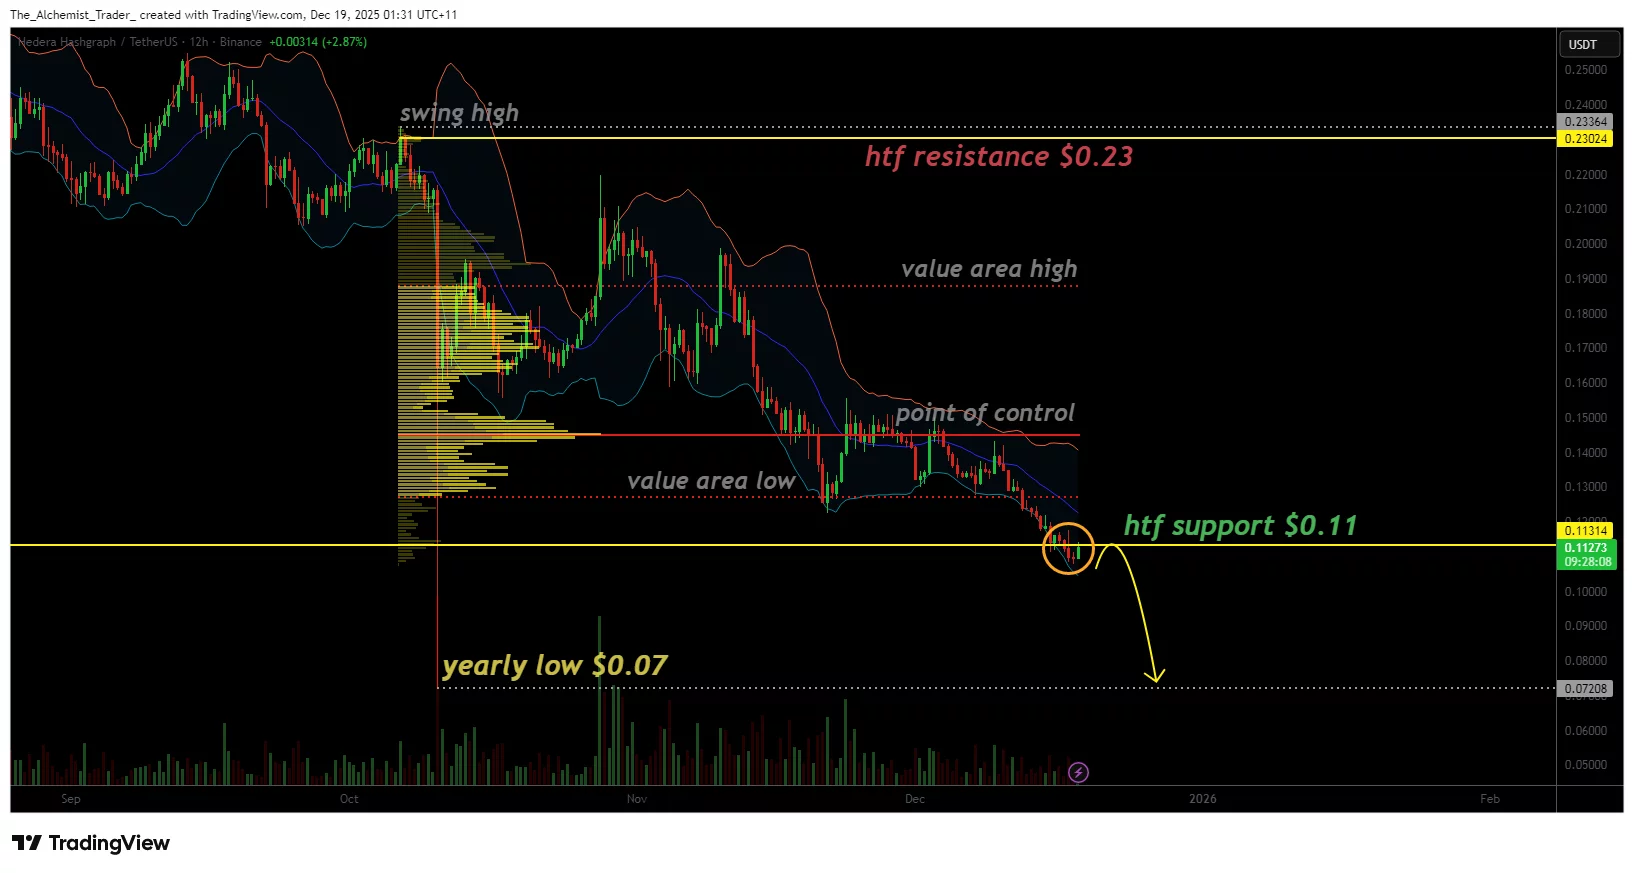
- HBAR prints consecutive lower highs and lower lows.
- High-time-frame support at $0.11 has failed.
- Downside risk now targets the $0.07 yearly low.
Hedera (HBAR) price remains under heavy selling pressure as price action continues to trend lower, reinforcing an aggressively bearish market structure. With consecutive lower highs and lower lows firmly in place, the technical outlook suggests that downside risk remains elevated.
The recent breakdown at critical support levels has further weakened bullish defenses, placing the $0.07 yearly low firmly in focus.
HBAR price key technical points
- HBAR maintains a bearish structure, defined by consecutive lower highs and lower lows.
- High-time-frame support at $0.11 is failing, removing a key defensive level for bulls.
- Downside risk now targets the $0.07 yearly low, where deeper liquidity resides.
HBAR’s current price behavior reflects sustained weakness rather than temporary consolidation. The market structure remains decisively bearish, as price continues to print lower highs and lower lows, a classic indication that sellers remain in full control. In trending markets, this structure typically persists until a clear reversal signal emerges, something that is currently absent on HBAR’s chart.
One of the most critical developments is the breakdown of high-time-frame support near $0.11. This level had previously acted as a key area of demand, where buyers attempted to slow the downtrend. However, price has now failed to respect this support, breaking below it with conviction.
Such behavior signals acceptance of lower prices rather than a brief liquidity sweep, despite ETF inflows and a recent Google BigQuery integration providing a fundamental boost to HBAR, underscoring the dominance of bearish technical pressure in the near term.
The $0.07 level represents a critical downside target for several reasons. First, it marks the current yearly low, making it a natural magnet for price during periods of sustained weakness.
Second, liquidity often accumulates around such levels as traders place stops, bids, and resting orders. Markets tend to seek out these liquidity pools, particularly when bearish momentum remains strong.
From a price-action perspective, the weakness is evident not only in structure but also in the lack of meaningful bullish reactions. Attempts at short-term bounces have been shallow and quickly sold into, reinforcing the idea that demand remains weak. This type of behavior is typical in strong downtrends, in which relief rallies fail to gain traction and instead create opportunities for sellers to re-enter.
Market structure further supports the bearish case. Until HBAR can break the sequence of lower highs and lower lows, the prevailing trend remains intact. Trend reversals require structural shifts, such as broken support reclamation, higher lows, or impulsive upside moves supported by volume. None of these conditions are currently present.
Given the loss of high-time-frame support and the absence of bullish confirmation, the path of least resistance remains to the downside. If selling pressure accelerates, price could move rapidly toward the $0.07 region in an accelerated or capitulation-style move, clearing remaining liquidity along the way. That said, the $0.07 level will be an important area to monitor if reached.
What to expect in the coming price action
As long as HBAR remains below the $0.11 high-time-frame support, downside risk remains elevated. Continued weakness increases the probability of a move toward the $0.07 yearly low. Any shift in bias will require a clear break in bearish structure and a reclaim of key resistance levels.


You May Also Like

The changing face of elder care in Malaysia — Sayed Mohammad Reza Yamani Sayed Umar

Not a loophole: Singapore AI export controls let China tap US AI legally

Exclusive interview with Smokey The Bera, co-founder of Berachain: How the innovative PoL public chain solves the liquidity problem and may be launched in a few months


