XRP price analysis: Descending triangle signals possible breakdown ahead
XRP price sits on a major support zone as its descending triangle tightens, indicating an imminent move.
- XRP trades near $2 inside a tightening descending triangle after a month of losses.
- Falling volume, weakening exchange-traded fund flows, and negative funding put pressure on buyers.
- A close below $2 may extend the downtrend, while a break above trendline would be a reversal signal.
XRP traded at $2.03 at press time , up about 1% in the last 24 hours. Over the past week, price has moved between $1.99 and $2.17, showing how tight the range has become as the market sits near the tip of a descending triangle.
The token is now down 14% in the past month and roughly 45% from the July all-time high of $3.65. Trading activity continues to cool.
Daily XRP (XRP) spot volume slipped to $3.08 billion, about 26% down, marking a clear decline in participation. Derivatives flow paints a similar picture, with CoinGlass data showing a 25% drop in futures volume to $4.16 billion and a small 0.65% pullback in open interest to $3.69 billion.
When both volume and OI weaken together, it usually suggests traders are avoiding heavy exposure and waiting for a decisive move.
Market pressure clouds short-term outlook
Weak fundamentals have added to the pressure. This week, ETF inflows dropped sharply, suggesting that interest in the new Ripple-linked products is starting to cool off.
Open interest in those ETFs slid about 15%, and funding rates dipped into negative territory, hinting that more traders are leaning toward short positions.
On top of that, Santiment flagged weakening social sentiment, with fear levels climbing to their highest point in weeks. The number of long positions also fell to unusually low levels.
The market did receive a notable catalyst on Dec. 11 through Hex Trust’s launch of wrapped XRP (wXRP), a 1:1 backed token connecting native XRP to Solana, Ethereum, Optimism, and HyperEVM through LayerZero.
The asset debuted with more than $100 million in initial total value locked and opens access to decentralized finance routes such as borrowing, farming, and trading using Ripple’s RLUSD stablecoin.
Early activity on Solana decentralized exchanges has already shown strong demand, and the bridge-free structure gives long-term holders a safer path to deploy liquidity.
XRP price technical analysis
The daily chart shows a large descending triangle, one of the clearest continuation structures in a downtrend. The upper trendline has been forming over several weeks, connecting a string of lower highs that show sellers stepping in earlier with every bounce.
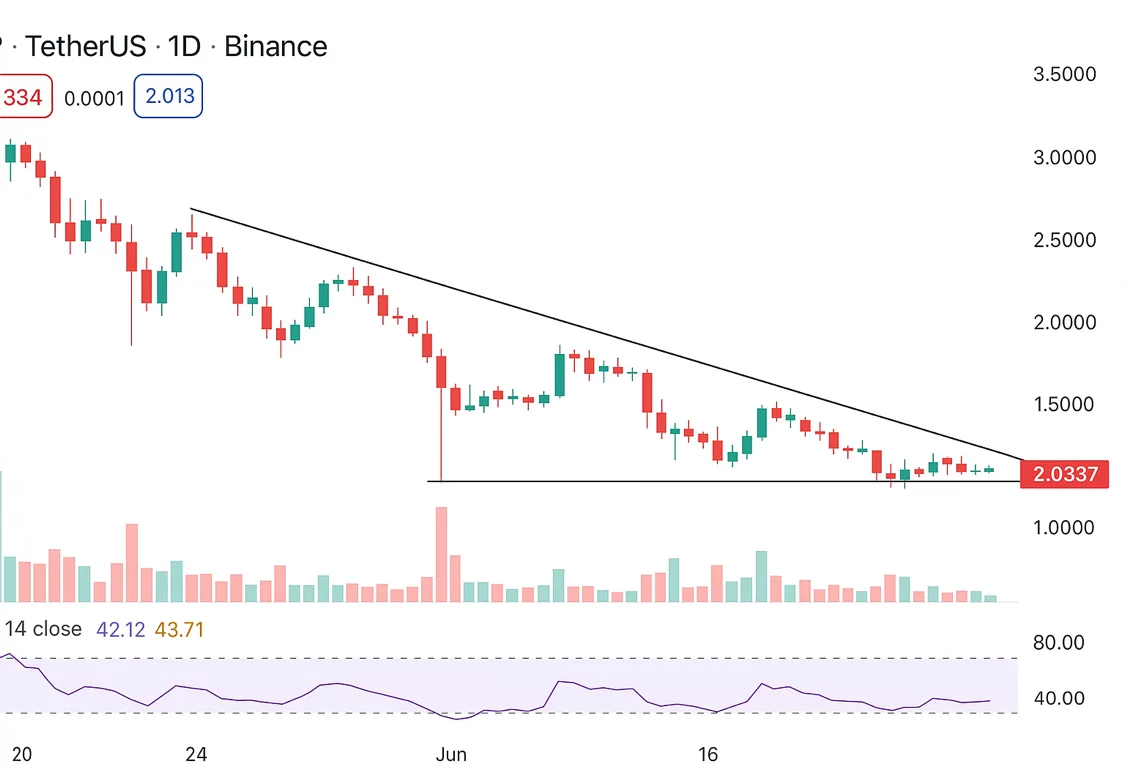
Although buyers have repeatedly defended the lower boundary at $2.00, their strength appears to be waning. A significant breakout or breakdown may be approaching as price action is now hovering close to the triangle’s tip.
Momentum is still rather subdued. While not oversold, the relative strength index is still displaying some weakness at 42. The tone is generally on the softer side because recent attempts to break into the mid-50s have failed.
The majority of moving averages across short, medium, and long timeframes are pointing down and sitting above the current price, and the MACD is still below zero, indicating a lack of upward drive.
A clean drop below $2.00 would confirm the descending triangle’s bearish continuation and make room for a move lower. A close above the trendline would invalidate the pattern and set up a stronger rebound, although that scenario carries lower probability based on present momentum.
You May Also Like
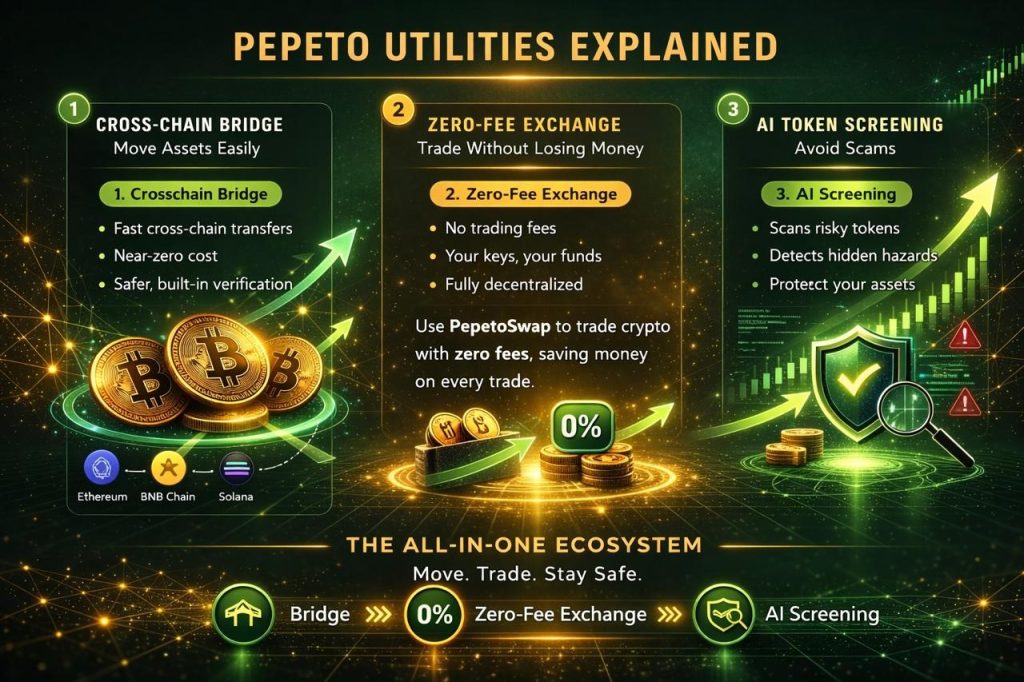
Next Crypto to Explode as Citigroup Cuts BTC to $112K: Pepeto Crosses $8M While HYPE and ZEC Drop

How Fraud Recovery Experts Handle Complex Crypto and Wire Fraud Cases