TLDR XRP ETFs attracted $245 million in inflows last week, beating Ethereum and Solana ETPs combined which only brought in $35 million total Total assets in XRP-linked ETFs have reached $935 million, with a 16-day positive inflow streak continuing despite recent market downturns XRP is trading around $2.11 with $3.73 billion in open interest and [...] The post XRP Price: Weekly ETF Inflows of $245M Exceed Ethereum and Solana Combined appeared first on CoinCentral.TLDR XRP ETFs attracted $245 million in inflows last week, beating Ethereum and Solana ETPs combined which only brought in $35 million total Total assets in XRP-linked ETFs have reached $935 million, with a 16-day positive inflow streak continuing despite recent market downturns XRP is trading around $2.11 with $3.73 billion in open interest and [...] The post XRP Price: Weekly ETF Inflows of $245M Exceed Ethereum and Solana Combined appeared first on CoinCentral.

XRP Price: Weekly ETF Inflows of $245M Exceed Ethereum and Solana Combined

TLDR

  • XRP ETFs attracted $245 million in inflows last week, beating Ethereum and Solana ETPs combined which only brought in $35 million total
  • Total assets in XRP-linked ETFs have reached $935 million, with a 16-day positive inflow streak continuing despite recent market downturns
  • XRP is trading around $2.11 with $3.73 billion in open interest and $5.76 billion in futures volume over the past 24 hours
  • The key support level to watch is $1.94, which analysts say XRP must hold to enable a potential rebound toward $2.50
  • XRP has held above $2 with steady derivatives activity, though the token continues printing lower highs with fading momentum

XRP exchange-traded funds pulled in $245 million last week, making the token the top performer among altcoin investment products. The inflows pushed total assets in XRP-linked ETFs to $935 million, according to data from SoSo Value.

The performance stands out when compared to other major cryptocurrencies. Ethereum and Solana ETPs combined brought in just $35 million during the same period. XRP ETFs have now maintained a 16-day streak of positive inflows.

The token currently trades around $2.11, up 0.9% over the past 24 hours. The price has moved between $2.05 and $2.17 in recent trading sessions. Spot volume reached $3.71 billion with a market cap near $127 billion.

xrp priceXRP Price

Futures markets show heavy activity around XRP. CoinGlass data indicates $3.73 billion in open interest and $5.76 billion in futures volume over the past day. This compares to $1.14 billion in spot turnover, suggesting derivatives markets are driving price discovery.

On-chain data from DeFiLlama shows approximately $37.5 billion in 24-hour perpetual DEX volume. Open interest on decentralized platforms sits around $15.2 billion. The XRPL ledger itself handled roughly $5.32 million in DEX volume with low fees.
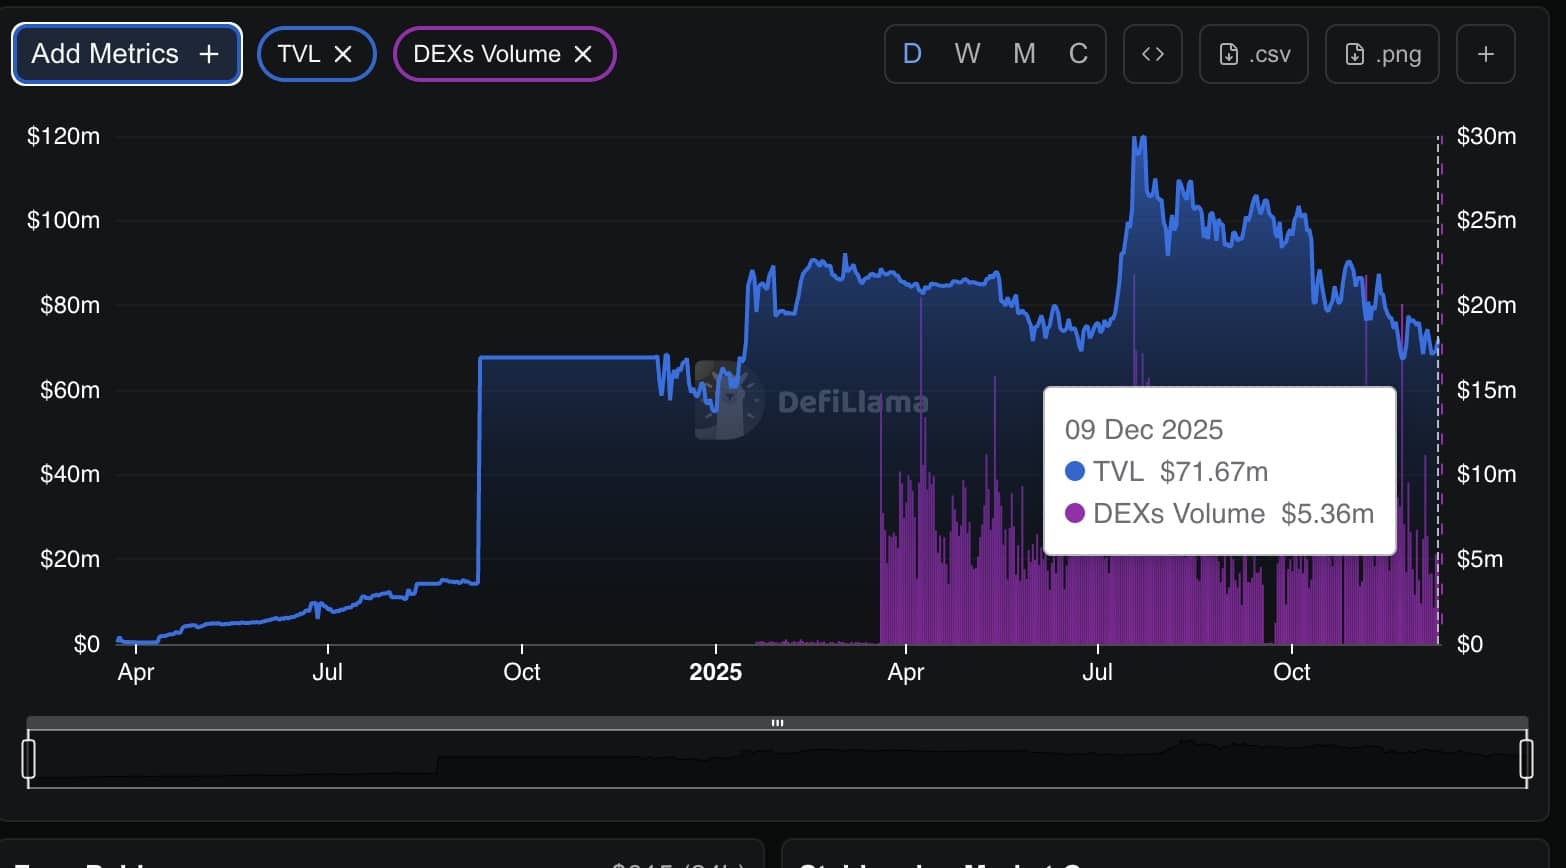
XRP trades near $2 with strong futures activity, high open interest, and key support at $1.94 shaping direction.Source: DefiLlama

Key Support Level at $1.94

The token has spent recent weeks trading in a range between $2.05 and $2.25 after declining from $2.60 earlier in November. XRP now approaches a critical support zone that could determine its next direction.

Analyst Ali Martinez identified $1.94 as the support level XRP must hold to set up a potential rebound toward $2.50. The price has bounced off this zone multiple times over the past year. Traders are watching this area closely as the token tests lower levels.

A breakout above $2.20 following the upcoming FOMC meeting could reverse the current downtrend. This would put $2.50 and potentially $3 within reach if buying pressure increases. The Relative Strength Index shows the price has entered a consolidation phase ahead of the Federal Reserve meeting.

Futures Activity Remains High

The gap between futures and spot volume continues to widen. Futures trading volume of $5.76 billion dwarfs the spot market’s $1.14 billion, indicating that derivatives traders are actively positioning themselves. Open interest remains elevated at $3.73 billion across major exchanges.

Most XRP trading still occurs on centralized platforms rather than on-chain venues. The relatively low DEX volume of $5.32 million on the XRPL ledger confirms this pattern. Synthetic exposure through perpetual contracts on decentralized platforms adds to the overall trading activity.

The token’s price action shows lower highs forming over recent weeks. Momentum indicators suggest sellers have not yet stepped back. A drop below $1.94 would likely trigger further downside movement. The market currently waits to see if this support level can withstand selling pressure.

XRP’s price stability near $2 comes as institutional interest through ETF products continues to grow, with the 16-day inflow streak showing sustained demand from traditional finance investors.

The post XRP Price: Weekly ETF Inflows of $245M Exceed Ethereum and Solana Combined appeared first on CoinCentral.

Market Opportunity
XRP Logo
XRP Price(XRP)
$1.9079
$1.9079$1.9079
-0.49%
USD
XRP (XRP) Live Price Chart
Disclaimer: The articles reposted on this site are sourced from public platforms and are provided for informational purposes only. They do not necessarily reflect the views of MEXC. All rights remain with the original authors. If you believe any content infringes on third-party rights, please contact service@support.mexc.com for removal. MEXC makes no guarantees regarding the accuracy, completeness, or timeliness of the content and is not responsible for any actions taken based on the information provided. The content does not constitute financial, legal, or other professional advice, nor should it be considered a recommendation or endorsement by MEXC.

You May Also Like

Microsoft Corp. $MSFT blue box area offers a buying opportunity

Microsoft Corp. $MSFT blue box area offers a buying opportunity

The post Microsoft Corp. $MSFT blue box area offers a buying opportunity appeared on BitcoinEthereumNews.com. In today’s article, we’ll examine the recent performance of Microsoft Corp. ($MSFT) through the lens of Elliott Wave Theory. We’ll review how the rally from the April 07, 2025 low unfolded as a 5-wave impulse followed by a 3-swing correction (ABC) and discuss our forecast for the next move. Let’s dive into the structure and expectations for this stock. Five wave impulse structure + ABC + WXY correction $MSFT 8H Elliott Wave chart 9.04.2025 In the 8-hour Elliott Wave count from Sep 04, 2025, we saw that $MSFT completed a 5-wave impulsive cycle at red III. As expected, this initial wave prompted a pullback. We anticipated this pullback to unfold in 3 swings and find buyers in the equal legs area between $497.02 and $471.06 This setup aligns with a typical Elliott Wave correction pattern (ABC), in which the market pauses briefly before resuming its primary trend. $MSFT 8H Elliott Wave chart 7.14.2025 The update, 10 days later, shows the stock finding support from the equal legs area as predicted allowing traders to get risk free. The stock is expected to bounce towards 525 – 532 before deciding if the bounce is a connector or the next leg higher. A break into new ATHs will confirm the latter and can see it trade higher towards 570 – 593 area. Until then, traders should get risk free and protect their capital in case of a WXY double correction. Conclusion In conclusion, our Elliott Wave analysis of Microsoft Corp. ($MSFT) suggested that it remains supported against April 07, 2025 lows and bounce from the blue box area. In the meantime, keep an eye out for any corrective pullbacks that may offer entry opportunities. By applying Elliott Wave Theory, traders can better anticipate the structure of upcoming moves and enhance risk management in volatile markets. Source: https://www.fxstreet.com/news/microsoft-corp-msft-blue-box-area-offers-a-buying-opportunity-202509171323
Share
BitcoinEthereumNews2025/09/18 03:50
WTI drifts higher above $59.50 on Kazakh supply disruptions

WTI drifts higher above $59.50 on Kazakh supply disruptions

The post WTI drifts higher above $59.50 on Kazakh supply disruptions appeared on BitcoinEthereumNews.com. West Texas Intermediate (WTI), the US crude oil benchmark
Share
BitcoinEthereumNews2026/01/21 11:24
MYX Finance price surges again as funding rate points to a crash

MYX Finance price surges again as funding rate points to a crash

MYX Finance price went parabolic again as the recent short-squeeze resumed. However, the formation of a double-top pattern and the funding rate point to an eventual crash in the coming days. MYX Finance (MYX) came in the spotlight earlier this…
Share
Crypto.news2025/09/18 02:57