Short-term wallets start to cut losses as capitulation climbs to 2022 FTX crash levels
BTC saw the biggest wave of capitulations since the crash of FTX. After holding through several price drops, short-term wallets have started to capitulate, absorbing previously unrealized losses.
BTC short-term holders were the biggest factor in the recent market capitulation. The latest cohorts of wallets had the biggest realized losses since 2022. The current market drawdown resembled the crash following the FTX collapse, though without the loss of big players or a sudden drop in liquidity.
Glassnode data showed long-term holders still had limited realized losses, as they accumulated at a much lower price. The BTC average realized price is at $54,622, standing at an all-time peak.
In 2025, the biggest number of whales distributed their older holdings near price peaks. However, it was short-term buyers who capitulated during the latest dip to the $80,000 range.
BTC short-term capitulation may signal a market bottom
BTC returned to a recent local high of $94,000, later sinking below $92,000 again. The market is showing signs of returning momentum, but remains shaky in the short term.
 BTC entered another period of rising realized losses. Historically, capitulations are linked to local price bottoms, often followed by a recovery. | Source: Newhedge
The selling and capitulation, however, are seen as a sign of a local bottom. In 2025, one of the biggest events of realized losses was in August, followed by another market upturn.
During the Bitcoin slide from its October peak, the capitulation did not happen until the asset touched local lows under $85,000. Retail and short-term buyers sold to cut losses, while whales and long-term holders usually sold closer to the peak.
In September, short-term holders were more willing to hold with unrealized losses, but the accelerating price slide pressure finally made some of the buyers capitulate at a lower price.
Not all short-term holders sold at a loss. Actually, on average, those wallets have a small net gain. The short-term holder realized price is at over $104,000 per BTC on average, higher than the current market price. The average price showed a wave of strategic short-term wallets that are still trading BTC, ready to realize gains at a favorable price.
Bitcoin volatility increases close to one-year peak
BTC volatility is showing the leading coin is entering a more turbulent trading period. Volatility expanded to 2.49%, close to the highest range for the past 12 months.
Usually, BTC volatility remained below 2% in 2025, entering a more mature market period. This period is a timely reminder from BTC to the market that it can still face waves of panic, especially following de-leveraging events.
BTC still trades with a fearful sentiment, putting the fear and greed index at 28 points.
More selling pressure can come from miners, who are producing blocks under distressed conditions for the first time since August. The hash ribbon indicator flashed again after a months-long period of highly profitable mining.
Historically, hash ribbons indicators roughly coincide with local bottoms for the market, or periods of higher volatility.
Join a premium crypto trading community free for 30 days - normally $100/mo.
You May Also Like

Your Gateway To The Next Promising Altcoin

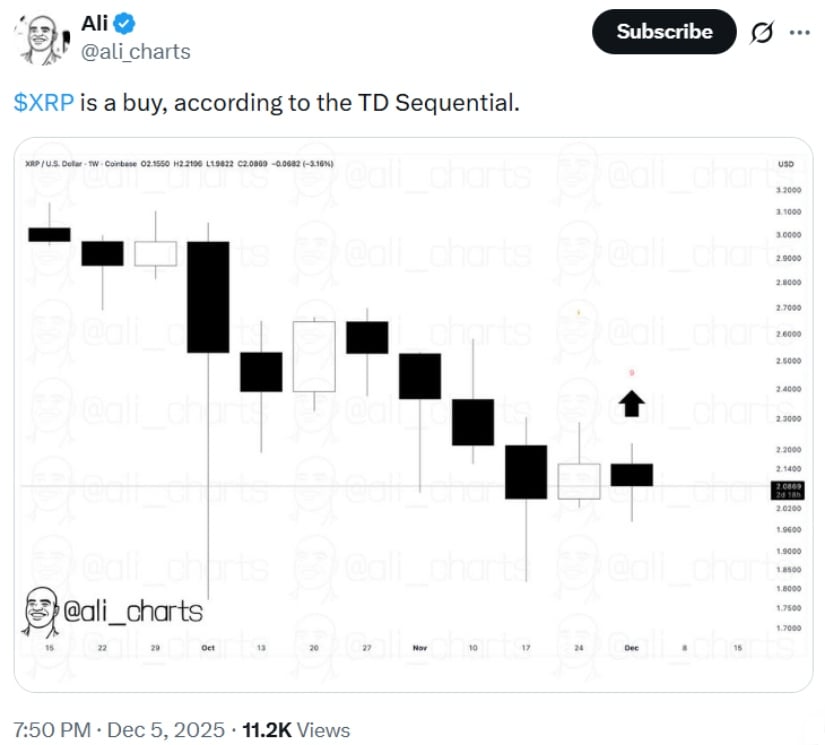
XRP Moves Sideways Above $2.00