

Ethereum Price Surges 17% as ETF Inflows Hit $291M in Four Days
Ethereum ETH $3 059 24h volatility: 0.9% Market cap: $368.33 B Vol. 24h: $20.27 B price reclaimed the $3,000 level on Friday, rising 17% from the weekly low of $2,620 logged on November 21.
The recovery has been driven primarily by institutional flows, with US Ethereum ETFs posted $291 million in net deposits over back-to-back sessions since November 21, according to FardiseInvestors data.
ETF demand has revived discretionary buying across derivatives and spot markets. Strategy-focused investors also returned to accumulation mode.
Arkham reported on Friday that Tom Lee–linked wallets saw another $44.3 million ETH inflow into Bitmine-linked wallets, pushing total weekly purchases to $185.6 million. These renewed inflows have propelled Ethereum double-digit price recovery as it reached intraday peaks near $3,070 on November 28.
In a press release on Nov 24 confirming its annual shareholders meeting for January 2026 in Las Vegas, Lee emphasized Ethereum’s strong short-term support at $2,500. He also made a bold prediction that Ethereum price could be poised for an imminent supercycle.
Ethereum Price Forecast: Can Bulls Trigger a Breakout Toward $4,600?
Institution-driven inflows have powered a 17.8% Ethereum price rebound over the past eight days, while a clearly defined falling-wedge structure now outlines a potential 50% upside move. A falling wedge is a bullish reversal pattern that forms when price compresses between downward-sloping trendlines, signaling weakening seller control and an eventual breakout to the upside.
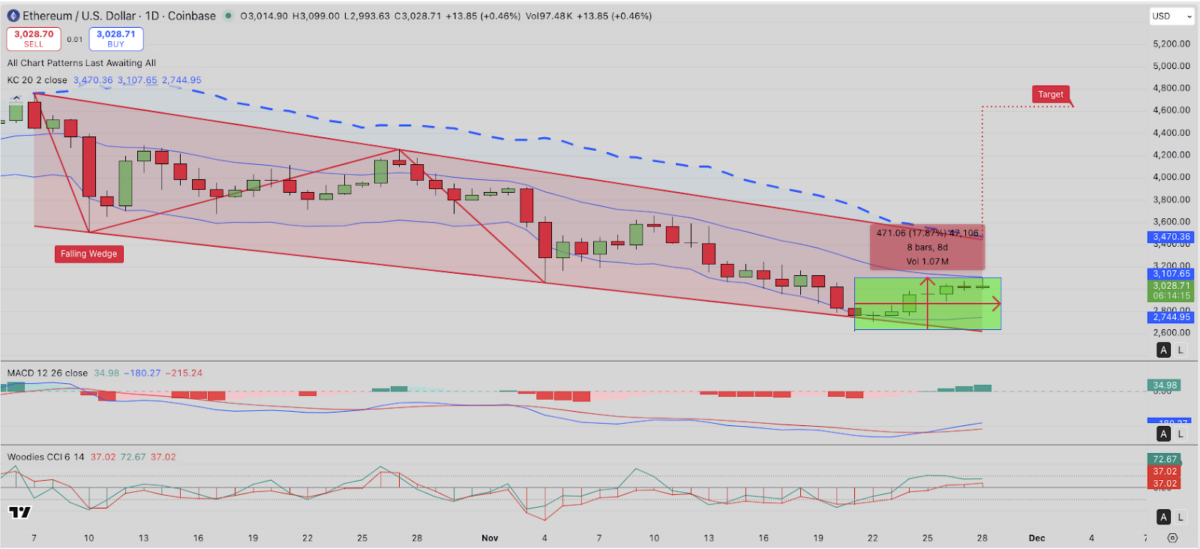
Ethereum (ETH) Technical Price Analysis | Source: TradingView
As ETH approaches the next major resistance cluster beneath the Keltner Channel middle band at $3,108, momentum indicators are firming. MACD has crossed into positive territory, and Woodies CCI has reclaimed the zero line with a sequence of higher lows, reflecting improved liquidity and market sentiment.
A daily close above the mid-wedge resistance zone at $3,150–$3,200 would confirm a full bullish breakout. If validated, the completed wedge resolution projects a measured move toward $4,500–$4,600, marking a 53% advance from current ETH prices.
However, the bullish setup weakens if ETH price loses its $2,880 support shelf. A breakdown below that level risks momentum compression and could force a retest of $2,744 near the lower Keltner boundary, which would invalidate the upside scenario.
nextThe post Ethereum Price Surges 17% as ETF Inflows Hit $291M in Four Days appeared first on Coinspeaker.


You May Also Like

Goatseus Maximus (GOAT) Price Prediction 2026, 2027-2030

Not a loophole: Singapore AI export controls let China tap US AI legally

LIST: Bayanihan initiatives amid soaring oil prices


