

XRP crypto today: sentiment, levels and scenarios to watch
 The narrative around XRP crypto today is being shaped by a market that looks cautious rather than euphoric. While prices hover around 2.22 USDT, the broader context shows investors wrestling with fear, positioning, and the search for direction. In this piece we will connect sentiment, trend structure, and key levels to outline where the asset stands and how it might move next.
 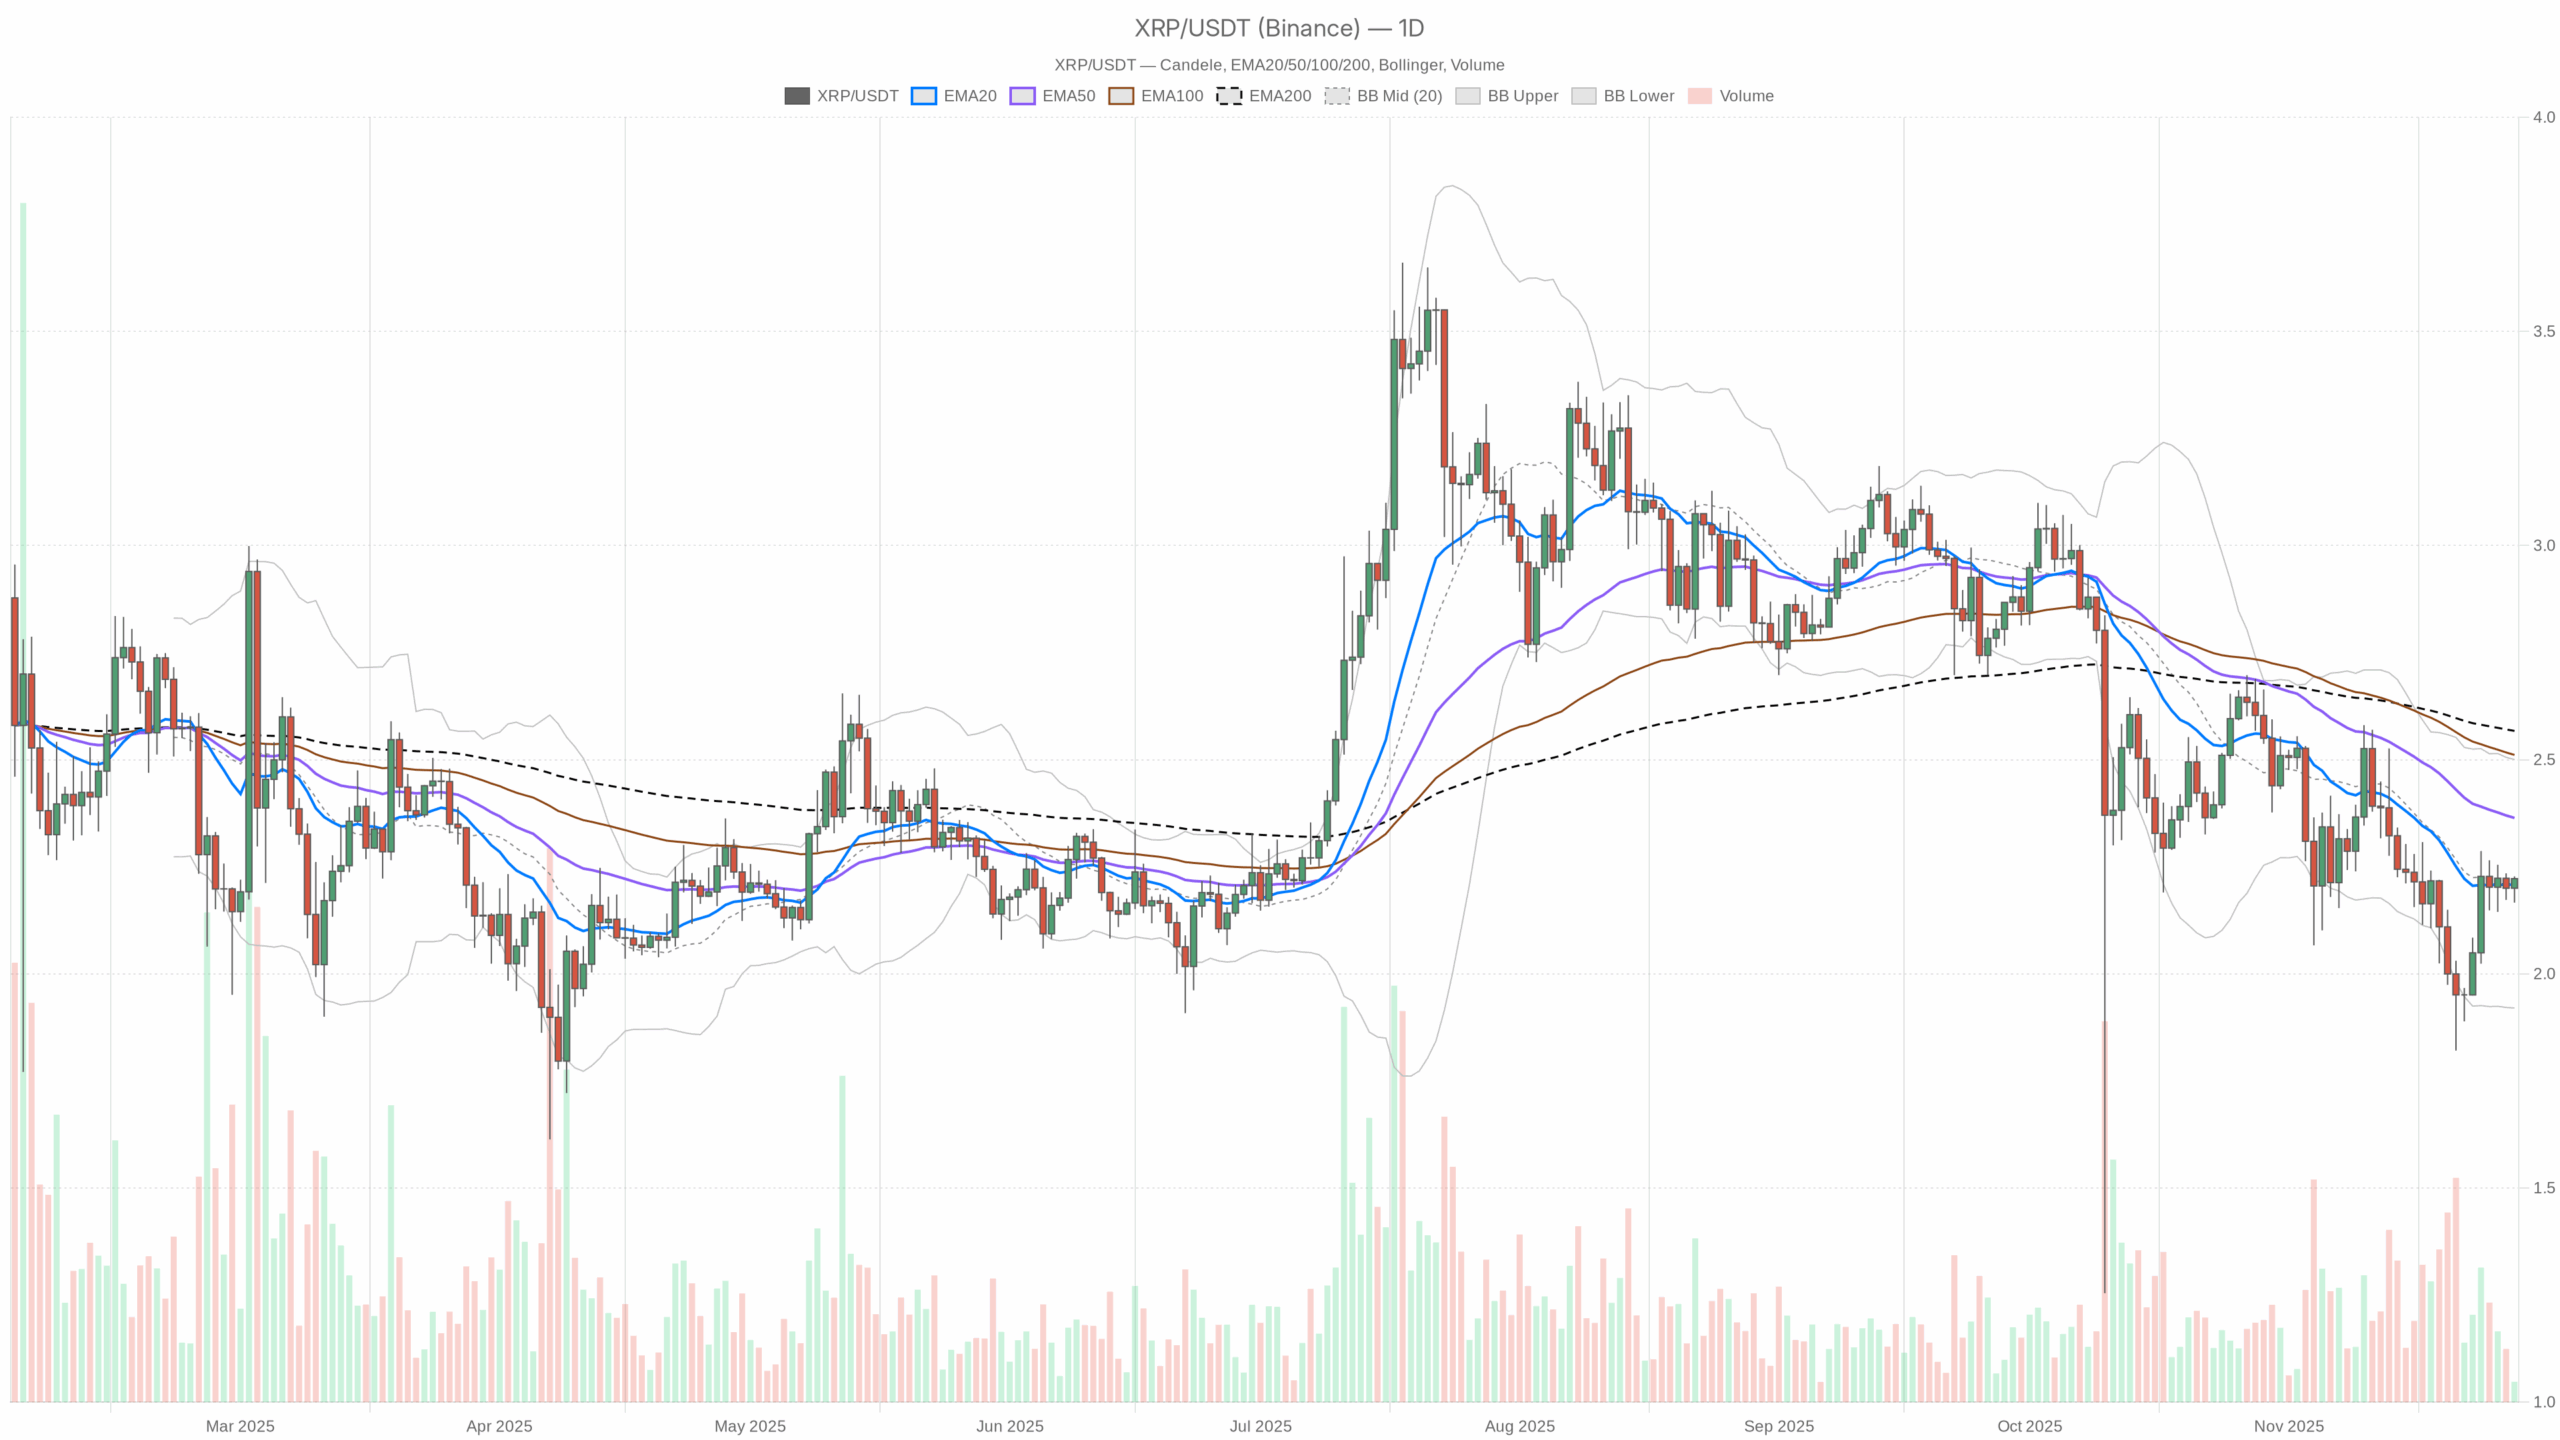 XRP/USDT — daily chart with candlesticks, EMA20/EMA50 and volume.
Summary
The daily chart points to a neutral market regime, with the price almost glued to the 20-day average around 2.21. Momentum is balanced: the daily RSI sits near 49, slightly below the midline, hinting at hesitation rather than clear trend strength. MACD is marginally positive but close to flat, suggesting momentum exhaustion on both sides. Volatility is moderate, with the daily ATR near 0.14, keeping swings contained inside Bollinger Bands between roughly 1.92 and 2.50. Meanwhile, Bitcoin dominates over 56% of total crypto capitalization, confirming that capital is more defensive than speculative. Coupled with an Extreme Fear reading at 25 on the sentiment gauge, this backdrop encourages cautious trading and a focus on confirmation rather than aggressive bets.
XRP crypto today: Market Context and Direction
On the macro side, the total crypto market cap stands around 3.19 trillion dollars, but it has slipped about 0.3% in the last 24 hours. This mild contraction, combined with Bitcoin dominance near 57%, reinforces a defensive regime where liquidity concentrates in the largest assets. Moreover, the Fear & Greed Index sitting in Extreme Fear signals that risk appetite is depressed. Participants are more inclined to protect capital than to chase altcoin rallies.
Within this environment, this pair does not appear to be a clear leader or laggard. Instead, it reflects the broader indecision: prices hold slightly above the short-term average, yet remain below the 50-day and 200-day EMAs. That said, the absence of heavy selling pressure around current levels suggests that investors are not capitulating. Rather, they seem to be waiting for a stronger macro or regulatory catalyst before committing to a new directional move.
Technical Outlook: reading the overall setup
On the daily timeframe, the asset trades at 2.22, almost perfectly aligned with the 20-day EMA at 2.21. This indicates a short-term equilibrium between buyers and sellers. However, the 50-day and 200-day EMAs, at 2.36 and 2.57 respectively, still sit clearly above price, framing a medium-term downtrend that has not yet been fully repaired.
The daily RSI at 48.58 reinforces this view of balance. It is neither oversold nor overbought, instead marking a zone where the market often consolidates before choosing a side. From a momentum perspective, MACD tells a similar story: the line is slightly negative at -0.06, but it is hovering just above the signal at -0.09, with a small positive histogram of 0.02. This configuration points to early signs of bullish momentum attempting to emerge from a flat backdrop, though not yet in a convincing way.
Bollinger Bands offer valuable context on volatility and potential breakout areas. The middle band aligns with the 20-day average at 2.21, while the upper and lower bands sit around 2.50 and 1.92. Price is currently near the center of this range, which typically corresponds to consolidation inside a well-defined volatility corridor. With the ATR at 0.14, daily swings are significant but not explosive, suggesting that any breakout beyond the bands would carry more informational weight than usual.
Intraday Perspective and XRPUSDT token Momentum
On the hourly chart, the picture turns more constructive. The price at 2.22 sits slightly above the 20-period EMA at 2.20 and the 50-period EMA at 2.20, while the longer 200-period EMA trails lower at 2.15. This stacked structure signals a short-term bullish bias on intraday horizons. The hourly RSI around 57.6 confirms that buyers hold a modest advantage, though without entering overheated territory.
Meanwhile, the 15-minute chart shows the asset at 2.22 with all three EMAs (20, 50, 200) tightly clustered near 2.20. The RSI rises to about 65, hinting at stronger short-term momentum that is pushing toward overbought but has not yet reached extremes. MACD on both intraday timeframes is essentially flat, indicating that while the trend has a bullish tilt, it is not accompanied by an explosive surge in participation. As a result, short-term traders appear cautiously optimistic, but they are still trading within the boundaries set by the daily consolidation.
Key Levels and Market Reactions
On the daily pivot map, the central reference level lies near 2.21. Holding above this line keeps the intraday bullish bias intact. The nearest resistance zone emerges around 2.24, where both the daily and hourly pivot structures converge. If price can close above that area with rising volume and expanding ATR, it would hint at a potential breakout setup toward the upper Bollinger region around 2.50.
On the downside, the first support sits near 2.18 on the daily chart, with shorter-term charts pointing to cushions around 2.20 and 2.21. A clear break and close below these levels would warn that buyers are losing control. In that case, the market could slide back toward the lower part of the Bollinger range near 1.92, testing whether the broader neutral regime can hold.
Future Scenarios and Investment Outlook
Overall, the charts present a market in transition rather than one locked into a firm trend. The daily structure still leans cautiously bearish in the medium term, since price remains under the 50-day and 200-day EMAs. However, intraday data show a gentle shift toward short-term accumulation, with buyers gradually pressing prices above key moving averages.
For swing traders, the most prudent approach is to wait for confirmation: either a sustained move above 2.242.36 to validate a more constructive narrative, or a failure of supports around 2.182.20 that would reopen the path toward the lower band. Longer-term investors, faced with Extreme Fear and high Bitcoin dominance, may see this as a time to scale in cautiously rather than to chase upside. In this sense, XRP crypto today sits at an inflection point where patience and disciplined risk management are likely to matter more than bold predictions.
This analysis is for informational purposes only and does not constitute financial advice.
Readers should conduct their own research before making investment decisions.
You May Also Like

PBOC sets USD/CNY reference rate at 6.8943 vs. 6.9041 previous

WTI Crude Oil Soars: Middle East Tensions Spark Critical Supply Fears and Market Volatility

