Bitcoin is a ‘strong relative buy’ with the sell-off nearly saturated, K33 says
Bitcoin's recent 36% downturn from all-time highs has pushed the market into what K33 describes as a sentiment-driven overshoot, with the research and brokerage firm arguing that the current dislocation is creating a compelling long-term entry point.
In a new report, K33 Head of Research Vetle Lunde said bitcoin has underperformed the Nasdaq in 70% of sessions over the past month — a rare pattern only seen a handful of times since 2020 — and is now 30% weaker relative to the index than it was on Oct. 8.
The last three notable stretches of bitcoin lagging the Nasdaq to such an extent all coincided with clear crypto-specific shocks — Mt. Gox and German government sales in July 2024, heavy Grayscale outflows in January 2024, and contagion effects in June 2022 — periods when correlations also weakened, Lunde noted.
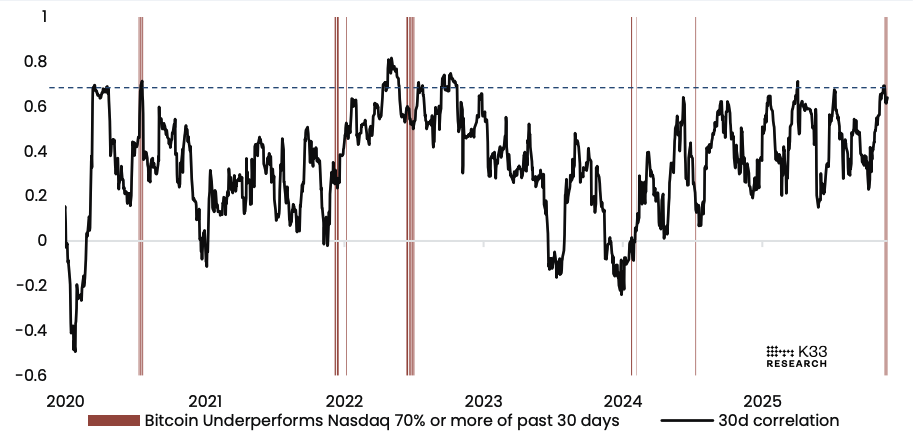
BTC 30-day correlation to Nasdaq and periods of sustained underperformance. Image: K33.
The latest stretch of relative underperformance emerged from the Oct. 10 deleveraging event, with bitcoin's price relative to the QQQ index falling to its lowest level since November 2024. To put it another way, bitcoin has fully retraced all relative strength gained after the U.S. election, and now sits below key relative levels last seen in 2021 and early 2024, Lunde said.
However, this time, correlations have surged, with bitcoin closely tracking equity moves but suffering sharper declines on down days and weaker rebounds on up days — a pattern K33 said reflects persistent selling pressure in a generally risk-off environment.
Nevertheless, Lunde emphasized that today's bitcoin market structure is materially different from prior cycles, citing crypto initiatives from Tier-1 banks enabled by the Clarity Act, and upcoming policy catalysts that may broaden access to the foremost cryptocurrency.
"We view the current relative pricing of BTC to other risk assets as a significant disconnect from the underlying fundamentals, and consider BTC a strong relative buy at current rates for any long-term focused investor," he said.
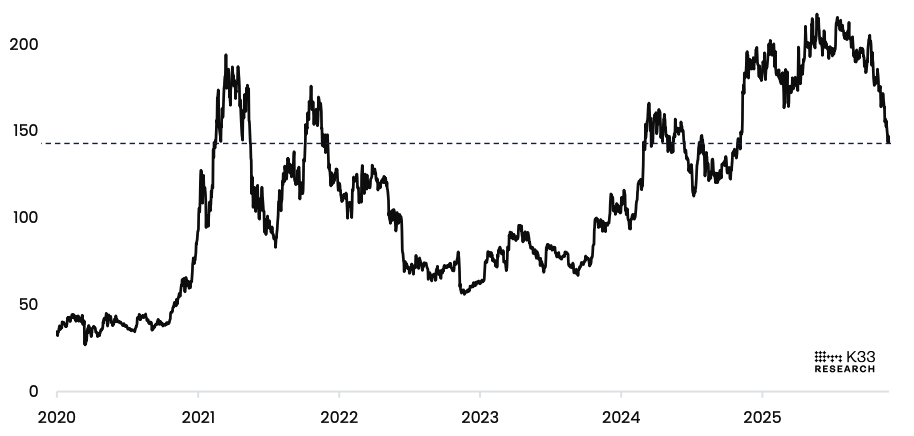
BTC/Nasdaq. Image: K33.
Panic signals and saturation
Lunde also argued that the sell-off appears close to its saturation area, supported by extreme trading activity during bitcoin's drop to an intraday low of $80,500 on Nov. 21. Spot volumes reached $14.3 billion that day — the sixth highest of 2025 — with 169,523 BTC traded — the fourth-largest BTC-denominated spot volume of the year.
Before October, all instances of daily spot volume above $10 billion occurred near local highs or lows, Lunde said. However, this pattern has reappeared four times during the current sell-off, reflecting intense buy-side demand around new support areas, he added, but resulting in only temporary relief so far.
On CME, Lunde also noted a contrarian rise in front-month premiums during the crash — a pattern previously seen during bitcoin's February to April bottoming pattern — though the broader term structure remains compressed. CME open interest sits at seven-month lows near 132,000 BTC, reflecting low risk appetite, he said.
Derivatives data further illustrates the market's positioning. Open interest in perpetual futures hit a yearly high of nearly 325,000 BTC during the sell-off before retreating to about 300,000 BTC as funding rates turned negative. Lunde interpreted the decline as aggressive long unwinding and an improvement over last week's overheated leverage regime, though open interest remains elevated.
Meanwhile, ETP flows have been showing signs of stress. Daily outflows exceeding 10,000 BTC are rare, having occurred just four times this year. Yet, two of those have come this month alone, including a 13,302 BTC outflow on Nov. 20 — the second-largest of 2025. Over the past 30 trading days, net outflows surpassed 62,000 BTC — reaching levels not seen since mid-March.
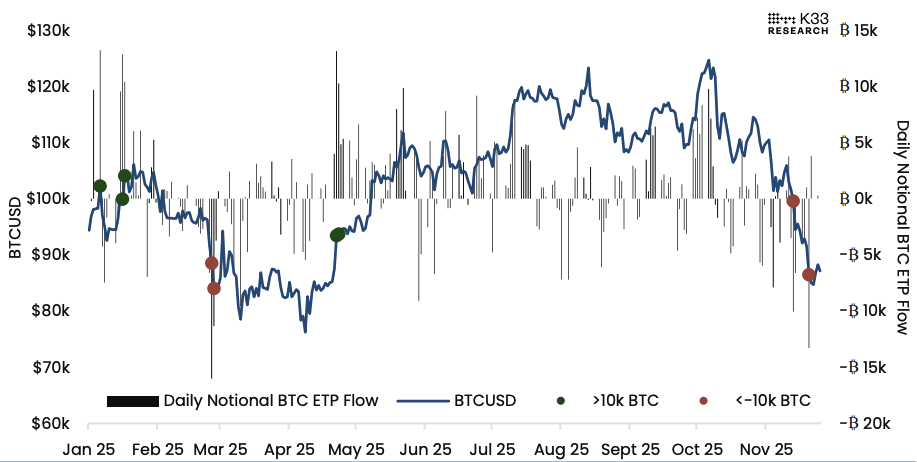
BTCUSD vs. BTC ETP Daily Flows. Image: K33.
However, Lunde described the surge in redemptions as "elevated panic" and typical of environments where sentiment temporarily overshoots fundamentals. K33 trimmed risk when bitcoin traded at $95,000 on Nov. 15 but re-entered with partial capital at $83,200 as the panic intensified.
"Nonetheless, we remain reluctant to re-enter BTC with full force amid still elevated notional OI in perps and BTC's typical pattern of forming a w-shaped recovery," Lunde added.
Disclaimer: The Block is an independent media outlet that delivers news, research, and data. As of November 2023, Foresight Ventures is a majority investor of The Block. Foresight Ventures invests in other companies in the crypto space. Crypto exchange Bitget is an anchor LP for Foresight Ventures. The Block continues to operate independently to deliver objective, impactful, and timely information about the crypto industry. Here are our current financial disclosures.
© 2025 The Block. All Rights Reserved. This article is provided for informational purposes only. It is not offered or intended to be used as legal, tax, investment, financial, or other advice.


You May Also Like

India talks big on AI, but markets are walking away

Alleged Dream Market Admin Charged in US for Laundering Crypto Into Physical Gold Bars