XRP dropped to $2.11 after 190M tokens were sold by whales. Price holds key support, but on-chain losses and weak signals raise pressure.XRP dropped to $2.11 after 190M tokens were sold by whales. Price holds key support, but on-chain losses and weak signals raise pressure.

190,000,000 XRP Sold in 48 Hours: What Happens Next With Ripple’s Price?

XRP has come under renewed pressure after a wave of selling from major holders. The token is trading near $2.11, down sharply on the week, as large transfers continue to shape market sentiment.

Whale Sales Add to Downward Pressure

Blockchain data reviewed by analyst Ali Martinez shows that wallets holding between 1 million and 10 million XRP moved out roughly 190 million tokens over the last two days. This reduction in supply from bigger wallets lines up with XRP’s latest drop to just over $2 on most exchanges.

The pattern is not new; as reported earlier this month, the ongoing whale exit signals that XRP is not yet out of a fragile phase. Large holders have been trimming their positions steadily over the past month, adding weight to each downturn.

Notably, the market has processed nearly $5.9 billion in trading volume in the last 24 hours, showing that activity remains high. Even so, the recent selling streak raises questions about how long the current pressure will last.

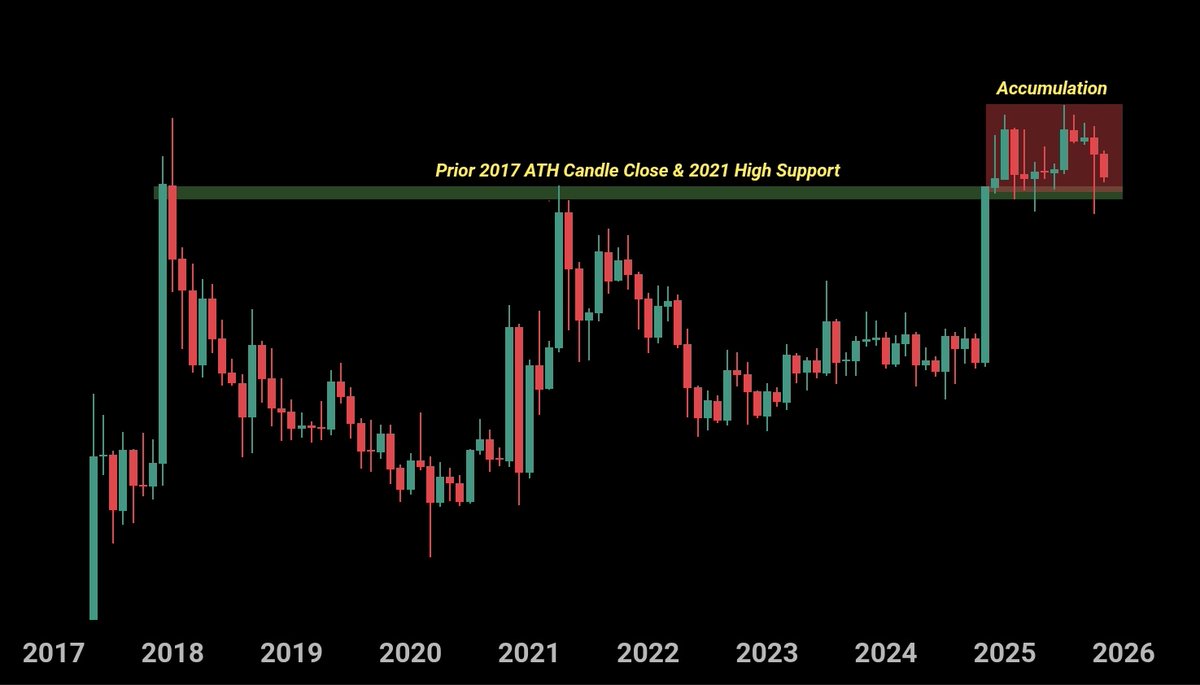
Long‑Term Support Remains Intact

One area still holding firm is the long‑term support zone that marks the 2017 monthly candle closes and the highs from 2021. This band, which acted as tough resistance for years, has now served as support for almost twelve months.

Analyst ChartNerd described the range as nearly a full year of steady participation. The price has moved sideways along this zone, forming a wide base rather than a clean trend. The structure suggests the level still matters, even as momentum weakens on shorter timeframes.

XRP price chartSource: ChartNerd/X

Meanwhile, another view comes from Rose Premium Signals, which identified a support window between $2.10 and $2.00. The asset is now sitting close to this area while trading inside a descending channel.

If buyers show interest, the move could create a path toward targets around $2.87, $3.07, and $3.28, with extended levels set at $4.00, $4.60, and $5.30. The protection zone for this setup sits near $1.80.

The chart suggests a break above the channel could spark a push higher, though this depends on market strength returning.

Broader Conditions Show Ongoing Strain

Recent on‑chain readings indicate that nearly half of XRP’s circulating supply is now held at a loss. This reflects mounting pressure on wallets that bought near the top. XRP has also slipped into oversold conditions, which may attract short‑term traders, but the broader environment remains cautious.

The next move of XRP will likely hinge upon the holding of key support after heavy selling and weak technical signals.

The post 190,000,000 XRP Sold in 48 Hours: What Happens Next With Ripple’s Price? appeared first on CryptoPotato.

Market Opportunity
XRP Logo
XRP Price(XRP)
$1.9018
$1.9018$1.9018
-0.80%
USD
XRP (XRP) Live Price Chart
Disclaimer: The articles reposted on this site are sourced from public platforms and are provided for informational purposes only. They do not necessarily reflect the views of MEXC. All rights remain with the original authors. If you believe any content infringes on third-party rights, please contact service@support.mexc.com for removal. MEXC makes no guarantees regarding the accuracy, completeness, or timeliness of the content and is not responsible for any actions taken based on the information provided. The content does not constitute financial, legal, or other professional advice, nor should it be considered a recommendation or endorsement by MEXC.

You May Also Like

The Surprising 2025 Decline In Online Interest Despite Market Turmoil

The Surprising 2025 Decline In Online Interest Despite Market Turmoil

The post The Surprising 2025 Decline In Online Interest Despite Market Turmoil appeared on BitcoinEthereumNews.com. Bitcoin Searches Plunge: The Surprising 2025
Share
BitcoinEthereumNews2026/01/21 14:56
Cryptos Signal Divergence Ahead of Fed Rate Decision

Cryptos Signal Divergence Ahead of Fed Rate Decision

The post Cryptos Signal Divergence Ahead of Fed Rate Decision appeared on BitcoinEthereumNews.com. Crypto assets send conflicting signals ahead of the Federal Reserve’s September rate decision. On-chain data reveals a clear decrease in Bitcoin and Ethereum flowing into centralized exchanges, but a sharp increase in altcoin inflows. The findings come from a Tuesday report by CryptoQuant, an on-chain data platform. The firm’s data shows a stark divergence in coin volume, which has been observed in movements onto centralized exchanges over the past few weeks. Bitcoin and Ethereum Inflows Drop to Multi-Month Lows Sponsored Sponsored Bitcoin has seen a dramatic drop in exchange inflows, with the 7-day moving average plummeting to 25,000 BTC, its lowest level in over a year. The average deposit per transaction has fallen to 0.57 BTC as of September. This suggests that smaller retail investors, rather than large-scale whales, are responsible for the recent cash-outs. Ethereum is showing a similar trend, with its daily exchange inflows decreasing to a two-month low. CryptoQuant reported that the 7-day moving average for ETH deposits on exchanges is around 783,000 ETH, the lowest in two months. Other Altcoins See Renewed Selling Pressure In contrast, other altcoin deposit activity on exchanges has surged. The number of altcoin deposit transactions on centralized exchanges was quite steady in May and June of this year, maintaining a 7-day moving average of about 20,000 to 30,000. Recently, however, that figure has jumped to 55,000 transactions. Altcoins: Exchange Inflow Transaction Count. Source: CryptoQuant CryptoQuant projects that altcoins, given their increased inflow activity, could face relatively higher selling pressure compared to BTC and ETH. Meanwhile, the balance of stablecoins on exchanges—a key indicator of potential buying pressure—has increased significantly. The report notes that the exchange USDT balance, around $273 million in April, grew to $379 million by August 31, marking a new yearly high. CryptoQuant interprets this surge as a reflection of…
Share
BitcoinEthereumNews2025/09/18 01:01
Strategy Makes Biggest Bitcoin Bet In Months With $2.13B Buy

Strategy Makes Biggest Bitcoin Bet In Months With $2.13B Buy

The post Strategy Makes Biggest Bitcoin Bet In Months With $2.13B Buy appeared on BitcoinEthereumNews.com. Strategy Makes Biggest Bitcoin Bet In Months
Share
BitcoinEthereumNews2026/01/21 15:07