Internet computer crypto outlook: neutral trend, key levels to watch
 Internet computer crypto is navigating a delicate balance between caution and opportunity, with ICP/USDT now sitting in a broadly neutral zone where direction is still up for grabs. In this climate, traders are trying to understand whether the current pause will resolve into a renewed advance or a deeper retracement.
 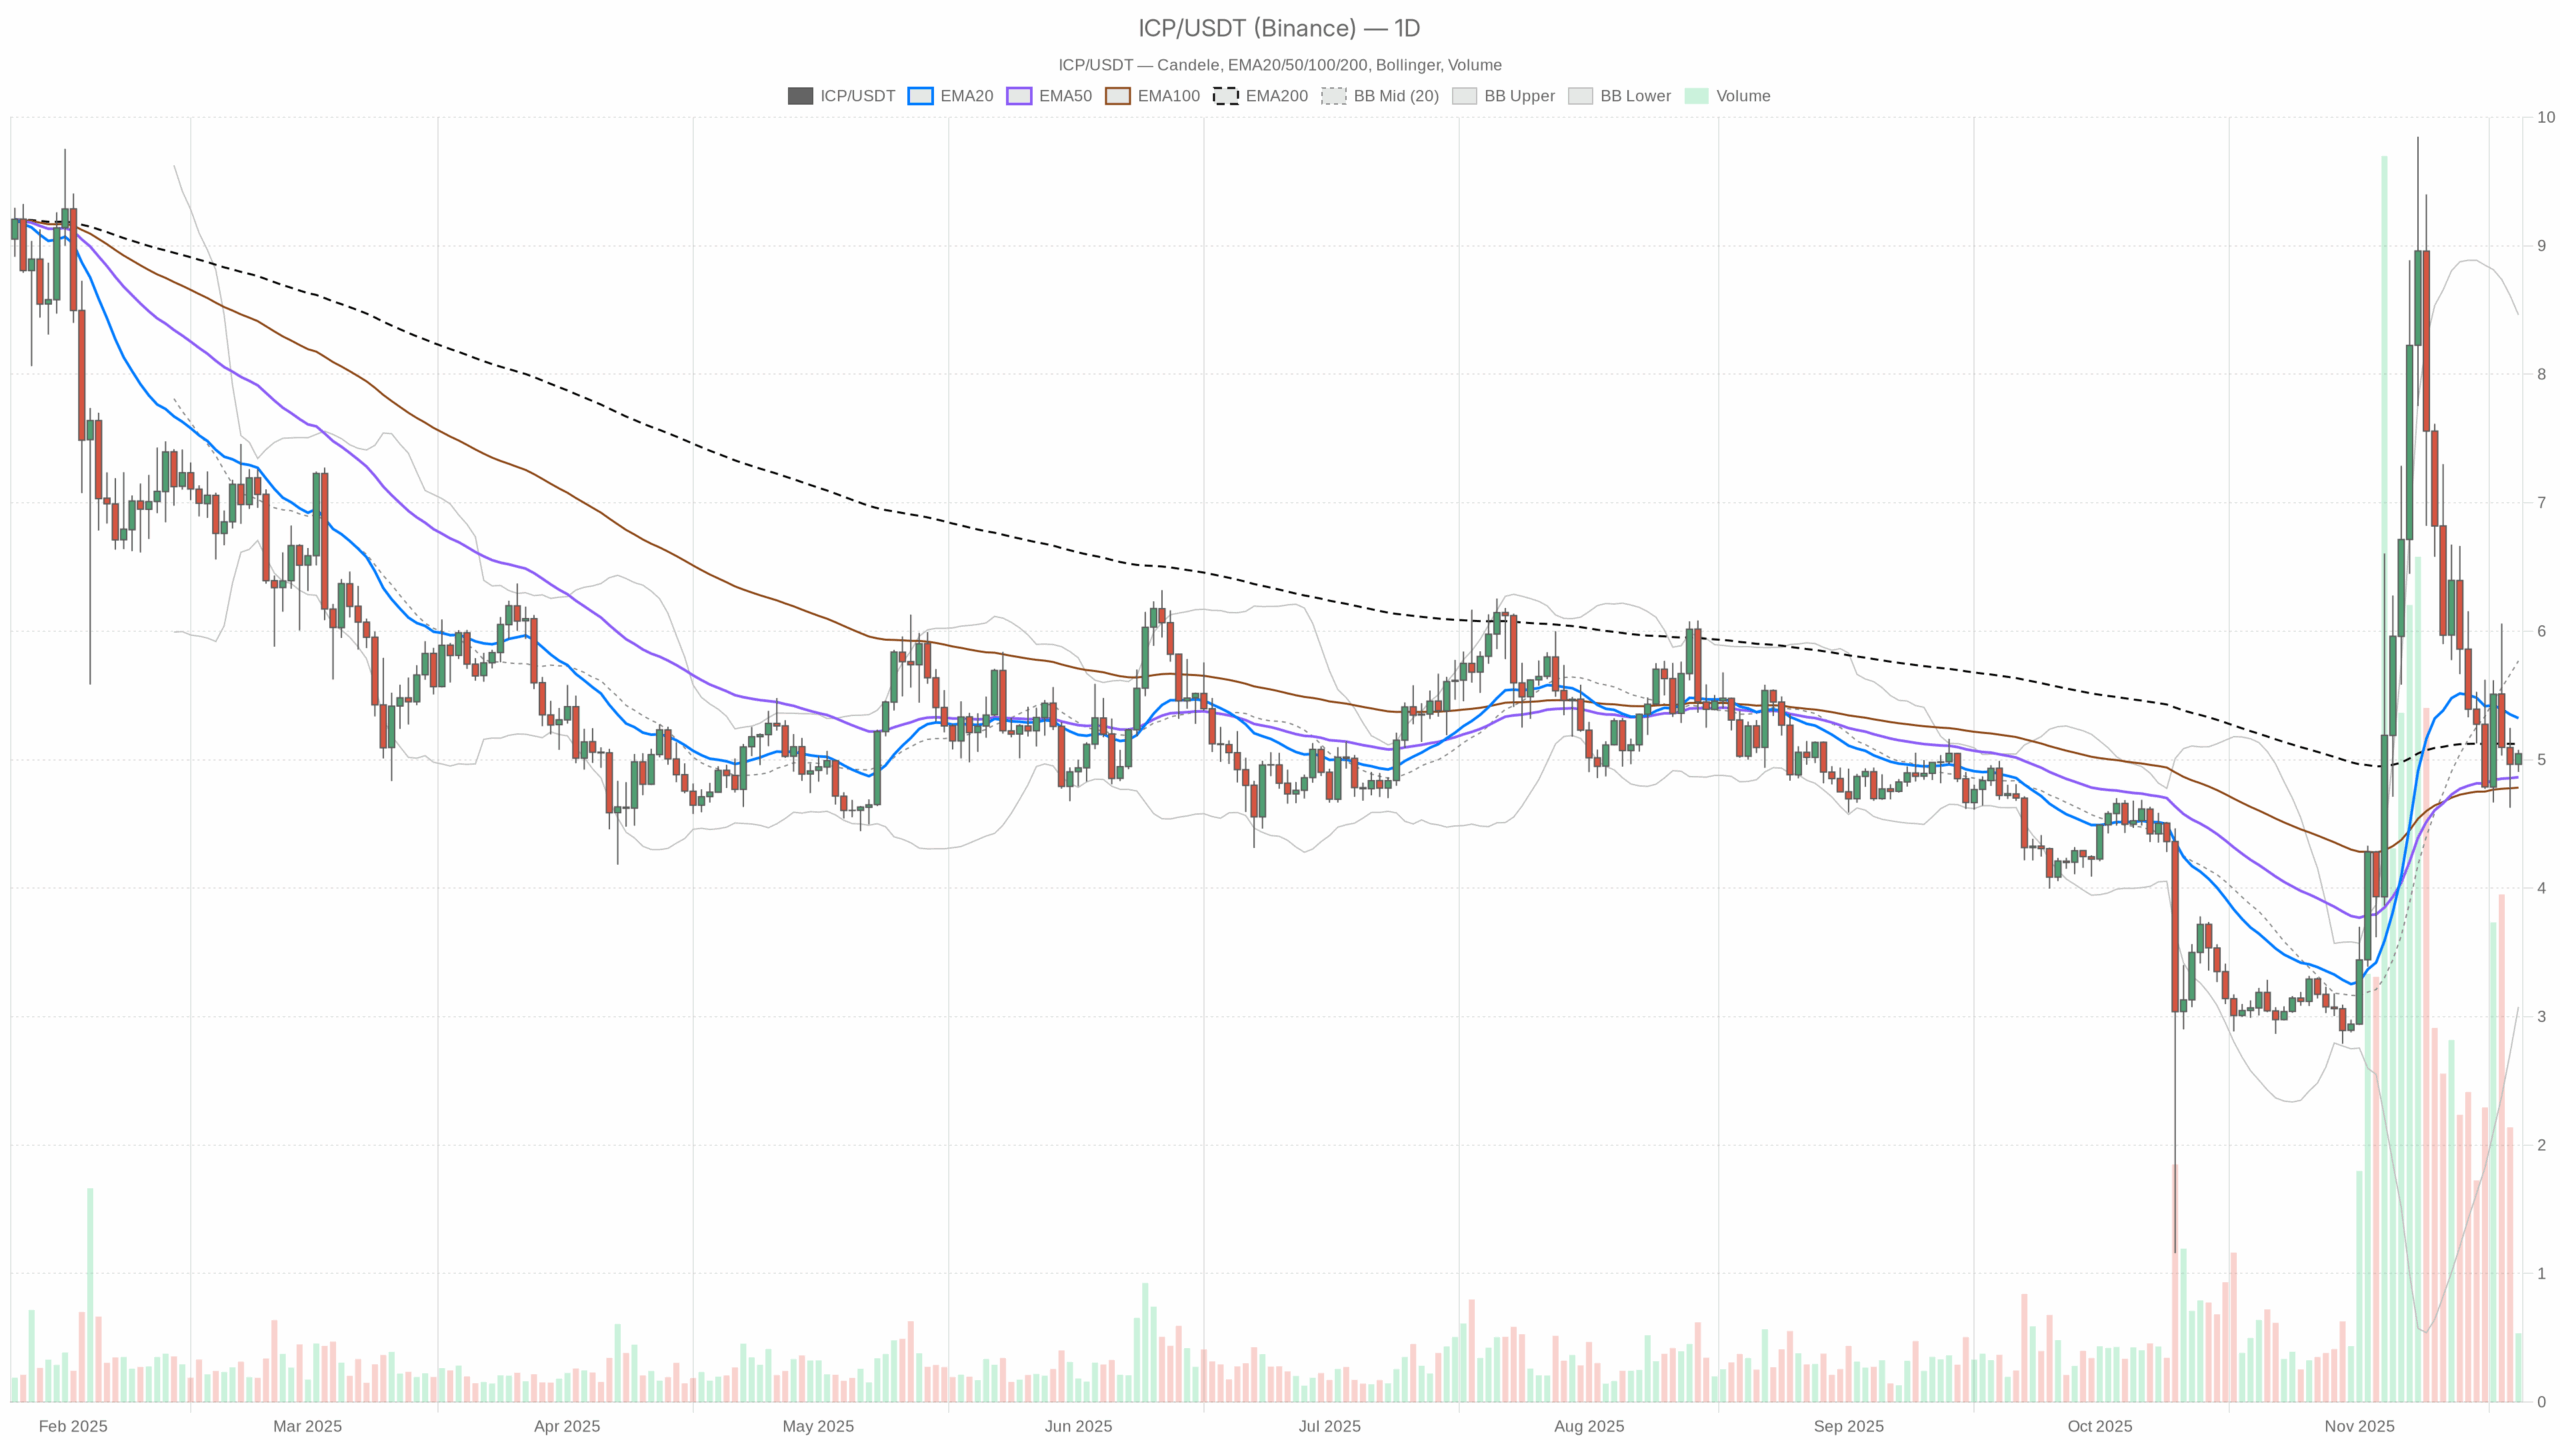 ICP/USDT — daily chart with candlesticks, EMA20/EMA50 and volume.
Summary
The asset is trading around 5.05 USDT, close to its daily pivot, underlining a lack of clear directional conviction for now. On the daily chart, price is below the 20-day EMA but above the 50-day EMA, depicting a market that recently cooled after a prior advance. RSI near 49 suggests balanced momentum, with neither bulls nor bears firmly in control. Moreover, MACD’s negative histogram points to waning upside momentum after previous strength. Volatility is moderate on the higher timeframe but contracts significantly intraday, showing a phase of short-term consolidation. Meanwhile, sentiment across crypto is fragile, constrained by high Bitcoin dominance and extreme fear on the broader market gauge.
Internet computer crypto: Market Context and Direction
The broader market backdrop helps explain why ICPUSDT has slipped into a neutral posture. Total crypto capitalization sits near 3.21 trillion dollars, with a marginal daily decline, hinting at a market that is pausing rather than collapsing. Moreover, Bitcoin’s dominance at about 57% confirms that capital is clustering in the largest asset, leaving alternative projects with less room to run aggressively.
The Fear & Greed Index at 11, firmly in “Extreme Fear”, reveals how nervous investors are. In such an environment, even technically constructive setups often struggle to attract follow-through buying. That said, this level of pessimism can also plant the seeds for contrarian rebounds, especially for coins that are not in clear downtrends. For the token on the internet-computer chain, the message is that the macro tide is cautious but not yet decisively hostile, aligning with its current neutral regime.
Technical Outlook: reading the overall setup
On the daily timeframe, the price at 5.05 trades below the 20-day EMA at 5.32, but still above the 50-day EMA at 4.86. This configuration often signals a cooling phase after a prior upswing, where the shorter average turns down while the medium-term trend remains intact. As a result, the chart is best described as a neutral-to-softening bullish structure rather than an outright bearish trend.
The 200-day EMA at 5.12 is slightly above the current price, reinforcing the idea that the market is testing the boundary between a maturing uptrend and a possible shift to a more defensive stance. If price can reclaim and hold above this long-term gauge, it would offer trend confirmation to the upside. Conversely, repeated failures beneath it could gradually tilt the bias more negative.
RSI at 48.95 on the daily chart supports this middle-of-the-road stance. It neither signals overbought nor oversold conditions, indicating that the recent selling has been orderly rather than panicked. This kind of RSI behavior typically aligns with range-bound trading, where breakouts require a new catalyst.
MACD adds another subtle but important layer. The main line at 0.22 sits below its signal at 0.45, with a negative histogram of -0.23. This shows that upside momentum has faded and that bulls have lost their earlier edge. However, the values remain close to the zero line, suggesting a momentum pause rather than a deep reversal, which again fits with the neutral regime.
Bollinger Bands on the daily chart, with a midline around 5.77 and a wide envelope between roughly 3.08 and 8.46, portray a market that has experienced significant moves in previous weeks. Yet the current price is hovering below the midpoint, hinting at a mildly corrective phase inside a broader, historically volatile range. ATR at about 1.16 reinforces this: daily swings are meaningful, but not in a state of panic-driven volatility expansion.
Intraday Perspective and ICPUSDT token Momentum
On the hourly chart, the picture is more constructive. Price at 5.05 is above the 20-hour EMA at 4.98 and roughly in line with the 50-hour EMA at 5.04, while still below the 200-hour EMA at 5.58. Meanwhile, the intraday regime is labeled neutral, but with a slight bullish tilt as shorter averages attempt to curl higher. As a result, short-term momentum traders may be probing the long side, even as higher timeframes remain undecided.
Hourly RSI around 55 signals modest positive momentum, with neither overheating nor exhaustion. MACD on this chart is marginally positive, with the line just above its signal and a tiny positive histogram, pointing to incremental buying pressure rather than aggressive accumulation. On the 15-minute timeframe, RSI climbs closer to 59, and EMAs are tightly stacked around price, illustrating a tight consolidation where intraday participants are testing the upside but still lack a strong breakout trigger.
Key Levels and Market Reactions
Daily pivot levels offer a helpful roadmap. The central pivot at 5.01 is being tested repeatedly, underlining this price as a key battleground between buyers and sellers. Just above, the first resistance area emerges near 5.11; a sustained move through this band could encourage a push toward the 200-day EMA and validate a short-term breakout attempt.
On the downside, immediate support lies around 4.94. If price dips into this zone and quickly bounces, it would confirm that buyers are still defending the lower edge of the current range. However, a decisive breakdown below that area, coupled with weakening intraday momentum, would open the door to a deeper retest of prior demand zones closer to the lower portion of the Bollinger range. Intraday pivots around 5.02–5.06 echo this tight equilibrium, showing how every small move is being contested.
Future Scenarios and Investment Outlook
Overall, Internet computer crypto sits at an inflection point where both patience and flexibility are crucial. The dominant scenario, based on the daily neutral regime and mid-range RSI, is continued consolidation with a slight risk that fading momentum drifts into a more defensive trend. If the asset can reclaim and hold above both the 200-day EMA near 5.12 and the daily resistance region around 5.11, the path would open for a renewed push higher, backed by trend re-acceleration.
In contrast, failure to defend the 4.94 support area, especially against a backdrop of persistent extreme fear and heavy Bitcoin dominance, would tilt the balance toward a more cautious, even mildly bearish outlook. In this scenario, investors may prefer staggered entries, strict risk management, and a focus on evidence of stabilization before committing fresh capital. Until a clear breakout or breakdown emerges, the most rational stance is to treat ICPUSDT as a range-trading candidate, with disciplined attention to intraday signals and the evolving macro sentiment.
This analysis is for informational purposes only and does not constitute financial advice.
Readers should conduct their own research before making investment decisions.


You May Also Like

Belgium eyes tech transfer over rare earths from Malaysia, not just raw exports

Strategic Sanctions: Tether Freezes USDT in TRON Wallets