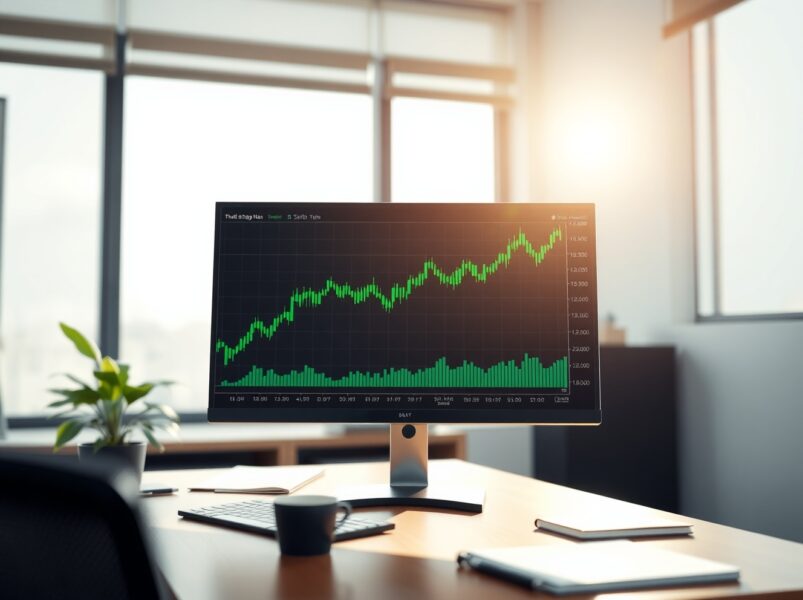
XRP price held a rising long-term trend while it compressed near support on November 2, 2025. The token traded in a narrow range as chart signals aligned with patterns from a prior advance.
Why XRP Price Held Support After Year-Long Consolidation
XRP price action showed a year of consolidation inside a wider uptrend. The token respected a rising trendline that started before the last major breakout.
The range stayed tight. Intraday moves clustered near the current level. Traders often viewed such bands as late-stage compression within larger structures.
Charts showed a symmetrical formation that dated back to the last expansion. Symmetrical structures described opposing trendlines that converged over time.
They often formed after strong impulses as markets reset. The pattern continued to print higher lows.
Higher lows meant buyers defended pullbacks at progressively higher levels. That behavior signaled demand persistence rather than a reversal.
No macro trendline break appeared during the consolidation. The absence of a break suggested trend continuity, not weakness.
Pullbacks respected structure and stopped above the long-term guide. Context mattered. The token followed a rhythm that also emerged before the 2017 surge.
Then, a prolonged squeeze released into a steep climb. Current structure shared that cadence, though without similar volatility.
Tight ranges typically limit noise and reduce whipsaws. They also build potential energy for later swings. Market participants monitored these setups for signs of expansion.
How XRP Price Aligns with Fibonacci and Momentum Signals
Fibonacci extensions mapped potential targets after an impulse wave. Technicians derived them by projecting ratios, such as 1.272, 1.414, and 1.618, from prior price swings.
These levels did not predict outcomes. They offered reference points that many traders watched. During the 2017 cycle, price reached the 1.272, 1.414, and 1.618 marks.
Those levels aligned near $0.14, $0.20, and $0.41. Price later corrected after tagging those extensions. The present cycle showed a similar grid at much higher numbers.
CurrentXRP price projections clustered near $8.50, $13.75, and $27.50. Those targets matched the upper bands of the visible structure.
The placement echoed the architecture seen before the 2018 move. This alignment did not guarantee future gains.
It framed areas where momentum could stall or accelerate. Traders used such levels as map points rather than fixed destinations.
Momentum corroborated the structural story. The Relative Strength Index measured the speed and magnitude of recent moves.
In 2017, RSI spiked into extreme territory above 90 during the blow-off phase. In the current cycle, the indicator followed a similar slope but with calmer amplitude.
That XRP price behavior matched a cooling phase within an ongoing uptrend. Taken together, structure and momentum pointed to a market that consolidated without breaking.
Price respected support, extensions remained valid, and the indicators stayed supportive. The combination argued for trend durability while the range persisted.
What Next: Trend Continuation or Failure?
The market watched for a decisive break from the narrow band. A firm close above nearby resistance would have signaled range expansion.
That action would have turned the compression into movement. Structural context still mattered more than any single print.
The rising trendline, the symmetrical formation, and the higher-low sequence set the backdrop. As long as price respected those guides, the broader uptrend remained the base case.
Fibonacci extension bands offered objective map points. Reactions around those numbers informed whether the move retained strength.
Strong advances often paused at an extension, consolidated, and then tested the next level. Momentum behavior helped confirm the move.
If RSI lifted toward prior cycle extremes without immediate reversal, trend continuation gained credibility. If RSI rolled over from mid-range while price failed at resistance, the setup weakened.
Volatility conditions also played a role. Compression phases often end with directional bursts. Traders watched follow-through on subsequent sessions to assess durability.
Liquidity conditions influenced execution but did not change the structure. Structure and momentum still defined the primary narrative.
In summary, the market tracked three items with respect to XRP price. First, whether price closes outside the tight band. Second, whether structure kept clocking higher lows above the rising guide.
Third, whether momentum stayed supportive rather than rolling over. If those elements aligned, the consolidation would have read as basing, not topping.
If they diverged, the case for a deeper pullback would have strengthened. The data to that point still supported the long-term trend framework.
Source: https://www.thecoinrepublic.com/2025/11/03/can-xrp-price-break-2-55-as-momentum-aligns-with-2017-pattern/