Blockchain analysis platform Glassnode has shared some important insights on Bitcoin’s liquidity levels amid a rather volatile market period. Notably, the leading cryptocurrency has struggled to maintain its “Uptober” form after a price surge to $126,000 was followed by a heavy correction to below $105,000. While Bitcoin has shown some recovery activity since then, it […]Blockchain analysis platform Glassnode has shared some important insights on Bitcoin’s liquidity levels amid a rather volatile market period. Notably, the leading cryptocurrency has struggled to maintain its “Uptober” form after a price surge to $126,000 was followed by a heavy correction to below $105,000. While Bitcoin has shown some recovery activity since then, it […]

Bitcoin’s Illiquid Supply Drops By 62,000 BTC – What’s Behind The Shift?

Blockchain analysis platform Glassnode has shared some important insights on Bitcoin’s liquidity levels amid a rather volatile market period. Notably, the leading cryptocurrency has struggled to maintain its “Uptober” form after a price surge to $126,000 was followed by a heavy correction to below $105,000. While Bitcoin has shown some recovery activity since then, it is yet to break above the $115,000 resistance, while its total monthly gain stands at 0.47%.

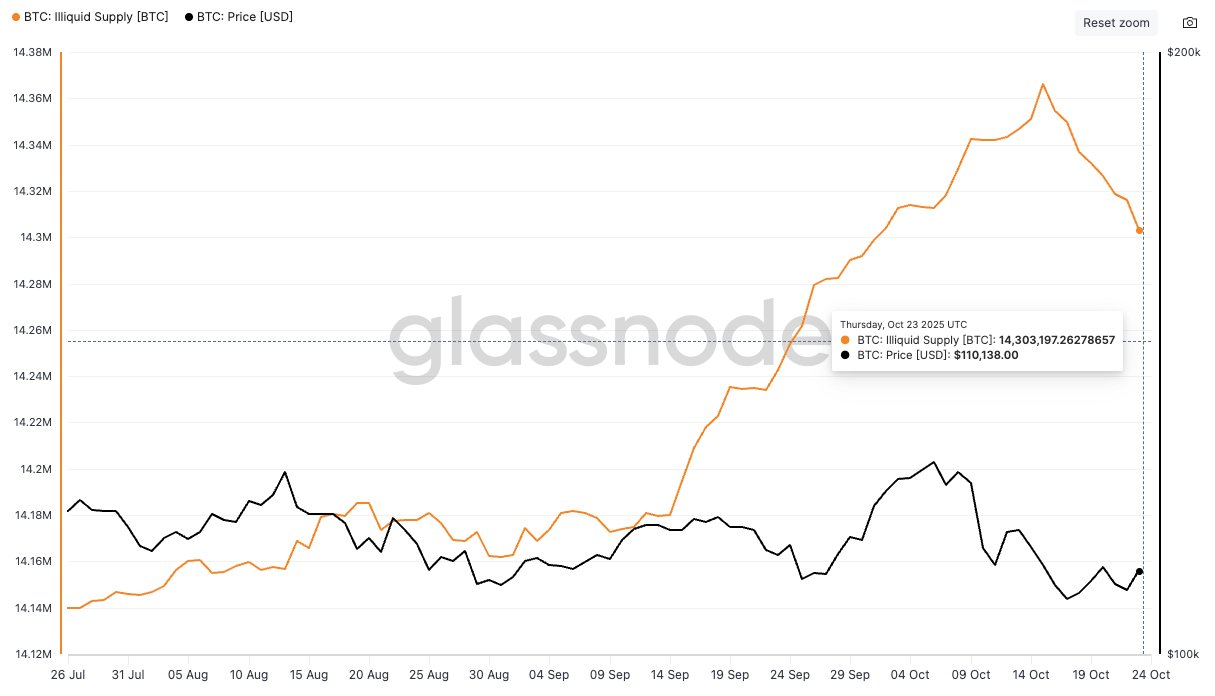
Bitcoin Liquidity Rises, Testing Demand Strength 

In an X post on October 25, Glassnode reports that Bitcoin’s illiquid supply has fallen by 62,000 BTC since mid-October.  For context, Illiquid Bitcoin refers to BTC that is held in wallets with little to no history of selling. They are essentially coins that are unlikely to move because their holders rarely spend and are considered off the market.

Therefore, a decline in illiquid BTC suggests that more coins are returning to active circulation, increasing available supply. This dynamic can make sustained price growth more challenging unless offset by a strong surge in demand.

Glassnode explains that illiquid supply growth has been a positive catalyst in this market cycle before this recent decline occurred. Historically, similar pullbacks, such as the 400,000 BTC decline in January 2024, have tended to slow market momentum by increasing the amount of Bitcoin in active circulation. 

Bitcoin

Who’s Behind The Sale? 

In analyzing this fall in illiquid BTC, Glassnode further discovered that Bitcoin whales’ accumulation activity has accelerated. In particular, BTC wallets have increased their holdings over the past 30 days and have yet to liquidate any large positions since October 15. 

Therefore, the rise in BTC liquidity has been driven by retail investors. More data from Glassnode reveals that wallets holding between 0.1-10 BTC, i.e. $10,000 to $1,000,000, have been producing consistent heavy outflows. In particular, this set of traders has been steadily reducing their BTC exposure since November 2024. 

In relation to recent price action, Glassnode analysts note that momentum buyers, primarily retail investors,  are increasingly exiting the market. Although dip buyers i.e., whales, have stepped up their activity, their demand has not been sufficient to absorb the excess supply, leading to the price imbalance currently observed.

At the time of writing, Bitcoin is trading at $111,570, reflecting a modest 0.89% gain over the past 24 hours. On higher timeframes, the leading cryptocurrency has recorded a 4.11% increase over the past week and a marginal 0.05% rise over the past month.

Bitcoin
Market Opportunity
Bitcoin Logo
Bitcoin Price(BTC)
$89 579,73
$89 579,73$89 579,73
-1,21%
USD
Bitcoin (BTC) Live Price Chart
Disclaimer: The articles reposted on this site are sourced from public platforms and are provided for informational purposes only. They do not necessarily reflect the views of MEXC. All rights remain with the original authors. If you believe any content infringes on third-party rights, please contact service@support.mexc.com for removal. MEXC makes no guarantees regarding the accuracy, completeness, or timeliness of the content and is not responsible for any actions taken based on the information provided. The content does not constitute financial, legal, or other professional advice, nor should it be considered a recommendation or endorsement by MEXC.

You May Also Like

Microsoft Corp. $MSFT blue box area offers a buying opportunity

Microsoft Corp. $MSFT blue box area offers a buying opportunity

The post Microsoft Corp. $MSFT blue box area offers a buying opportunity appeared on BitcoinEthereumNews.com. In today’s article, we’ll examine the recent performance of Microsoft Corp. ($MSFT) through the lens of Elliott Wave Theory. We’ll review how the rally from the April 07, 2025 low unfolded as a 5-wave impulse followed by a 3-swing correction (ABC) and discuss our forecast for the next move. Let’s dive into the structure and expectations for this stock. Five wave impulse structure + ABC + WXY correction $MSFT 8H Elliott Wave chart 9.04.2025 In the 8-hour Elliott Wave count from Sep 04, 2025, we saw that $MSFT completed a 5-wave impulsive cycle at red III. As expected, this initial wave prompted a pullback. We anticipated this pullback to unfold in 3 swings and find buyers in the equal legs area between $497.02 and $471.06 This setup aligns with a typical Elliott Wave correction pattern (ABC), in which the market pauses briefly before resuming its primary trend. $MSFT 8H Elliott Wave chart 7.14.2025 The update, 10 days later, shows the stock finding support from the equal legs area as predicted allowing traders to get risk free. The stock is expected to bounce towards 525 – 532 before deciding if the bounce is a connector or the next leg higher. A break into new ATHs will confirm the latter and can see it trade higher towards 570 – 593 area. Until then, traders should get risk free and protect their capital in case of a WXY double correction. Conclusion In conclusion, our Elliott Wave analysis of Microsoft Corp. ($MSFT) suggested that it remains supported against April 07, 2025 lows and bounce from the blue box area. In the meantime, keep an eye out for any corrective pullbacks that may offer entry opportunities. By applying Elliott Wave Theory, traders can better anticipate the structure of upcoming moves and enhance risk management in volatile markets. Source: https://www.fxstreet.com/news/microsoft-corp-msft-blue-box-area-offers-a-buying-opportunity-202509171323
Share
BitcoinEthereumNews2025/09/18 03:50
WTI drifts higher above $59.50 on Kazakh supply disruptions

WTI drifts higher above $59.50 on Kazakh supply disruptions

The post WTI drifts higher above $59.50 on Kazakh supply disruptions appeared on BitcoinEthereumNews.com. West Texas Intermediate (WTI), the US crude oil benchmark
Share
BitcoinEthereumNews2026/01/21 11:24
MYX Finance price surges again as funding rate points to a crash

MYX Finance price surges again as funding rate points to a crash

MYX Finance price went parabolic again as the recent short-squeeze resumed. However, the formation of a double-top pattern and the funding rate point to an eventual crash in the coming days. MYX Finance (MYX) came in the spotlight earlier this…
Share
Crypto.news2025/09/18 02:57