KEY POINTS: ➡️ DeepSeek AI forecasts a short-term Bitcoin correction to around $100K, driven by ETF outflows of 4.8K Bitcoin yesterday. ➡️ Bitcoin ($BTC) dropped roughly 6.7% in 24 hours to $104K, entering the ‘caution zone’ between $102K-$107K. ➡️ Long-term holders have moved over 265K $BTC this month, signalling the largest profit-taking shift since January. [...]KEY POINTS: ➡️ DeepSeek AI forecasts a short-term Bitcoin correction to around $100K, driven by ETF outflows of 4.8K Bitcoin yesterday. ➡️ Bitcoin ($BTC) dropped roughly 6.7% in 24 hours to $104K, entering the ‘caution zone’ between $102K-$107K. ➡️ Long-term holders have moved over 265K $BTC this month, signalling the largest profit-taking shift since January. [...]

DeepSeek AI Predicts Bitcoin Price Will Dip to $100K – Investors Turn to Bitcoin Hyper for Stability

DeepSeek AI Predicts Bitcoin Price Will Dip to $100K – Investors Turn to Bitcoin Hyper for Stability

KEY POINTS:

➡ DeepSeek AI forecasts a short-term Bitcoin correction to around $100K, driven by ETF outflows of 4.8K Bitcoin yesterday.

➡ Bitcoin ($BTC) dropped roughly 6.7% in 24 hours to $104K, entering the ‘caution zone’ between $102K-$107K.

➡ Long-term holders have moved over 265K $BTC this month, signalling the largest profit-taking shift since January.

➡ As volatility rises, investors are rotating toward presales like Bitcoin Hyper ($HYPER), which offers Layer-2 scalability and steady phase-by-phase growth.

The model has analyzed ETF flows, order book depth, and on-chain movement to flag elevated outflows from U.S. spot funds as the primary driver behind the latest selloff.

Bitcoin ($BTC) has fallen by approximately 6.7% in the last 24 hours, with its Relative Strength Index (RSI) nearing 37. An RSI below 30 is typically viewed as oversold, often leading to a potential short-term price rebound. While 37 is not yet in the oversold range, it suggests that Bitcoin is approaching it, which could indicate a temporary price bounce.

Data shows that institutional selling accelerated yesterday with 4.8K Bitcoin (around $530M worth) flowing out. This forced $BTC to lose its support near $110K and fall into what analysts refer to as the ‘caution zone’ between $102K and $107K.
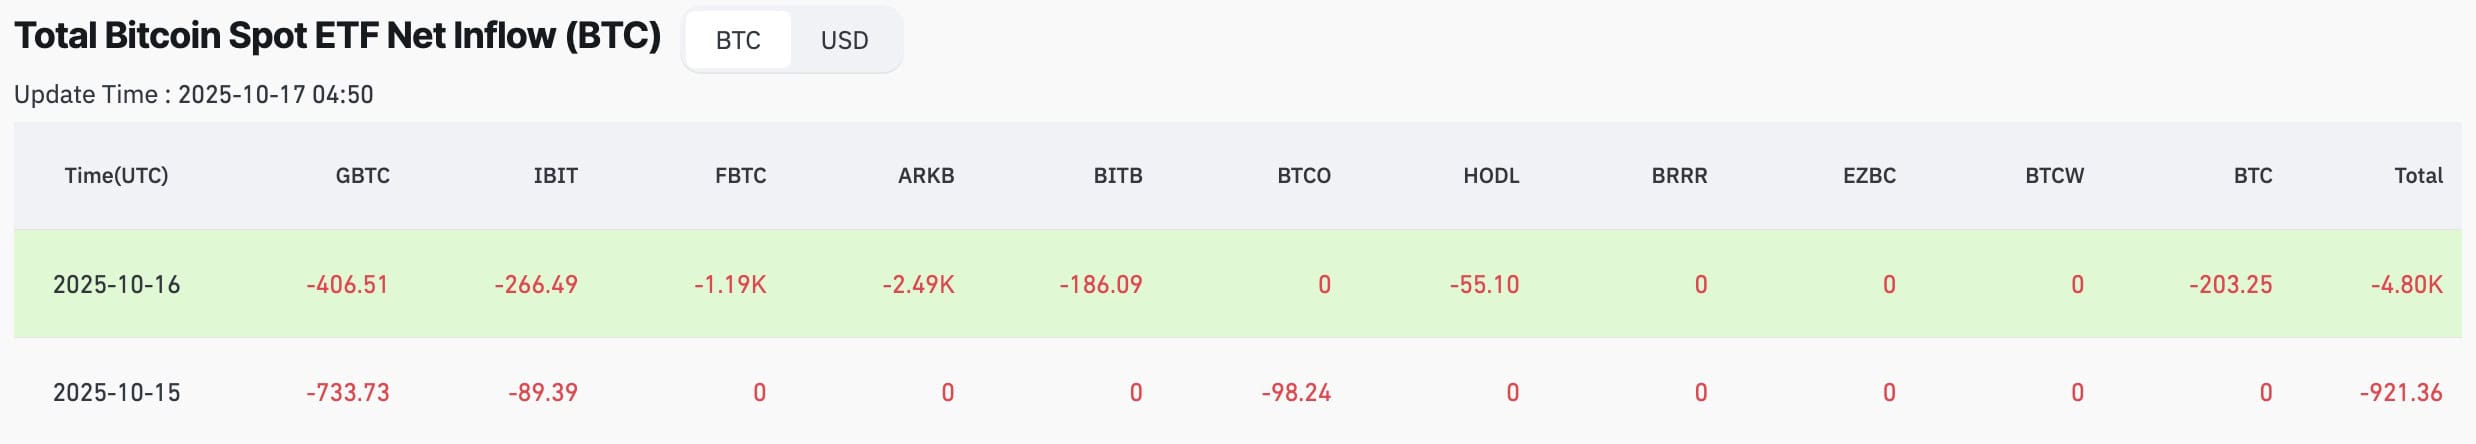
Total Bitcoin ($BTC) spot ETF inflows and outflows.

Source: Coinglass

DeepSeek claims that another cause of the recent selloff is the increased activity of long-term holders. Over 265K $BTC has been moved this month, the largest transfer since January.

But traders like to believe that this is simply ‘old money taking profit, new conviction stepping in.’

Bitcoin long-term holder net position change graph.

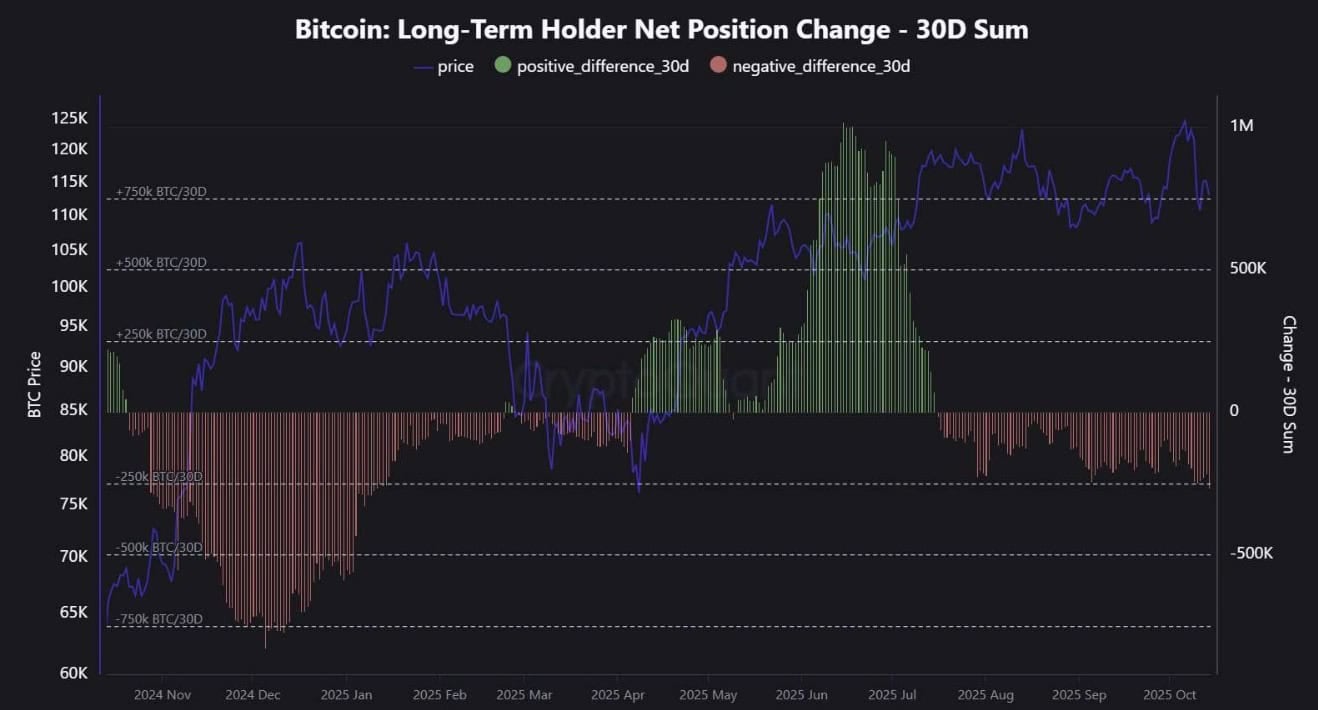
Source: @WhatIsTheTicker on CoinMarketCap

Still, DeepSeek’s model doesn’t see this as a collapse. Or the start of a bear market like you’ll read on crypto Twitter (now X). Instead, it points to a healthy reset that will fuel the next leg up.

Anyone with experience in crypto will stand by: the longer (and sometimes deeper) the choppy price action, the more explosive the move up.

However, periods like this often prompt capital to shift toward alternative investments. Some investors now seek ways to remain connected to Bitcoin’s upside without direct exposure to its volatility.

That’s why Bitcoin Hyper ($HYPER) is garnering significant attention – a new Layer-2 ecosystem designed to scale Bitcoin’s speed and utility, while offering presale investors structured, phase-by-phase growth.

Investors Rotate Toward Presales as Bitcoin Consolidates

Bitcoin’s pullback has investors split. Some see it as a short-term shakeout. Others panic, thinking it signals the start of a deeper rotation. Either way, the market’s tone has shifted from greed to caution.

And that’s often when early-stage projects start attracting fresh capital. Presales don’t move with market fear. Their prices only rise in incremental phases. So if the coins start to dump 10-20%, presales give investors a sense of control that’s rare in crypto.

So while $BTC tests support around $104K, fresh capital is flowing into $HYPER.

Bitcoin Hyper ($HYPER) – Bitcoin’s Speed Problem Finally Gets a Fix

Let’s be honest, Bitcoin’s biggest weakness has always been speed. According to data, the network handles just 6.28 transactions per second (TPS) in real-time. Add to that the high fees that often make small transfers impractical, and it doesn’t look good.

Bitcoin Hyper ($HYPER) was designed to address this issue. It’s a full L2 network that delivers Solana-level performance to Bitcoin, utilizing the Solana Virtual Machine (SVM) for sub-second execution.

You bridge $BTC to the Hyper network, where it’ll be mirrored 1:1. From there, you can trade or stake instantly with near-zero gas fees. This opens up a whole world of opportunities for DeFi, dApps, and meme coins all on Bitcoin.

How Hyper’s Canonical Bridge works

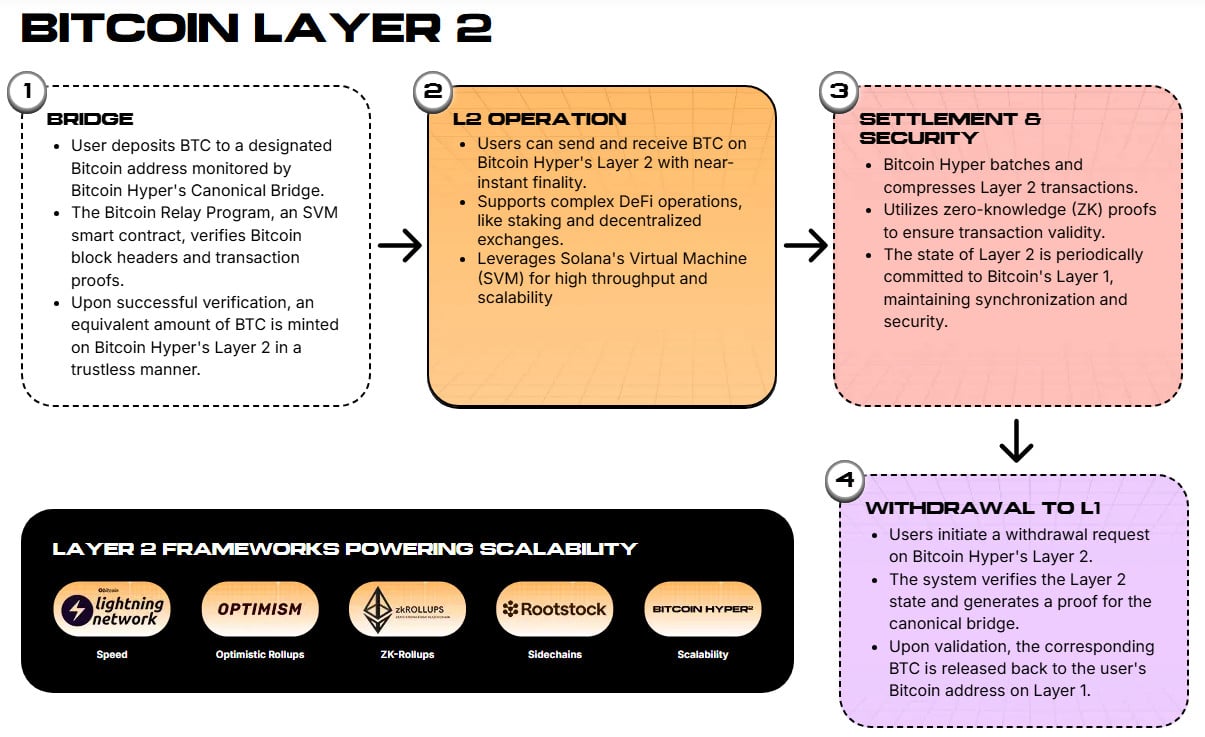
Later, the mirrored $BTC can be bundled back onto Bitcoin’s base chain, utilizing zero-knowledge (ZK) proofs for secure settlement. It’s not an attempt at a sidechain or a wrapped $BTC; it stays fully synced with Bitcoin for a trustless experience.

Learn how to buy Bitcoin Hyper in our step-by-step walkthrough.

Bitcoin Hyper is all cross-chain from day one. It connects with the Bitcoin, Solana, and Ethereum ecosystems, allowing assets and apps to move freely. Think of it as Bitcoin’s execution engine running on Solana-grade speed.

That combination has caught the eyes of investors. The project has already raised $23.96M, with tokens priced at $0.013125 ahead of the next phase. Analysts forecast a Bitcoin Hyper price prediction of up to $0.2 by the end of the year. That’s a mega 15x from today’s price.

Early buyers earn 49% APY through staking plus governance, airdrops, and launchpad access. On-chain trackers also show multiple six-figure buys in recent weeks, including $379.9K and $274K purchases. This indicates that there’s a firm conviction among whales in $HYPER.

Each presale phase lifts the price slightly, meaning no downside for early entries. While $BTC churns between $102K and $107K, $HYPER’s growth remains linear.

Buy $HYPER before the next price increase.

Market Opportunity
null Logo
null Price(null)
--
----
USD
null (null) Live Price Chart
Disclaimer: The articles reposted on this site are sourced from public platforms and are provided for informational purposes only. They do not necessarily reflect the views of MEXC. All rights remain with the original authors. If you believe any content infringes on third-party rights, please contact service@support.mexc.com for removal. MEXC makes no guarantees regarding the accuracy, completeness, or timeliness of the content and is not responsible for any actions taken based on the information provided. The content does not constitute financial, legal, or other professional advice, nor should it be considered a recommendation or endorsement by MEXC.

You May Also Like

Microsoft Corp. $MSFT blue box area offers a buying opportunity

Microsoft Corp. $MSFT blue box area offers a buying opportunity

The post Microsoft Corp. $MSFT blue box area offers a buying opportunity appeared on BitcoinEthereumNews.com. In today’s article, we’ll examine the recent performance of Microsoft Corp. ($MSFT) through the lens of Elliott Wave Theory. We’ll review how the rally from the April 07, 2025 low unfolded as a 5-wave impulse followed by a 3-swing correction (ABC) and discuss our forecast for the next move. Let’s dive into the structure and expectations for this stock. Five wave impulse structure + ABC + WXY correction $MSFT 8H Elliott Wave chart 9.04.2025 In the 8-hour Elliott Wave count from Sep 04, 2025, we saw that $MSFT completed a 5-wave impulsive cycle at red III. As expected, this initial wave prompted a pullback. We anticipated this pullback to unfold in 3 swings and find buyers in the equal legs area between $497.02 and $471.06 This setup aligns with a typical Elliott Wave correction pattern (ABC), in which the market pauses briefly before resuming its primary trend. $MSFT 8H Elliott Wave chart 7.14.2025 The update, 10 days later, shows the stock finding support from the equal legs area as predicted allowing traders to get risk free. The stock is expected to bounce towards 525 – 532 before deciding if the bounce is a connector or the next leg higher. A break into new ATHs will confirm the latter and can see it trade higher towards 570 – 593 area. Until then, traders should get risk free and protect their capital in case of a WXY double correction. Conclusion In conclusion, our Elliott Wave analysis of Microsoft Corp. ($MSFT) suggested that it remains supported against April 07, 2025 lows and bounce from the blue box area. In the meantime, keep an eye out for any corrective pullbacks that may offer entry opportunities. By applying Elliott Wave Theory, traders can better anticipate the structure of upcoming moves and enhance risk management in volatile markets. Source: https://www.fxstreet.com/news/microsoft-corp-msft-blue-box-area-offers-a-buying-opportunity-202509171323
Share
BitcoinEthereumNews2025/09/18 03:50
WTI drifts higher above $59.50 on Kazakh supply disruptions

WTI drifts higher above $59.50 on Kazakh supply disruptions

The post WTI drifts higher above $59.50 on Kazakh supply disruptions appeared on BitcoinEthereumNews.com. West Texas Intermediate (WTI), the US crude oil benchmark
Share
BitcoinEthereumNews2026/01/21 11:24
MYX Finance price surges again as funding rate points to a crash

MYX Finance price surges again as funding rate points to a crash

MYX Finance price went parabolic again as the recent short-squeeze resumed. However, the formation of a double-top pattern and the funding rate point to an eventual crash in the coming days. MYX Finance (MYX) came in the spotlight earlier this…
Share
Crypto.news2025/09/18 02:57