Bitcoin is once again testing investor conviction as it fights to stay above the $110,000 level following last Friday’s sharp correction that triggered a massive leverage wipeout across the market. After one of the most volatile sessions of the quarter, traders are watching closely to see whether BTC can stabilize or if more downside pressure […]Bitcoin is once again testing investor conviction as it fights to stay above the $110,000 level following last Friday’s sharp correction that triggered a massive leverage wipeout across the market. After one of the most volatile sessions of the quarter, traders are watching closely to see whether BTC can stabilize or if more downside pressure […]

Bitcoin SOPR Shows Market Nearing Post-Correction Levels

2025/10/17 08:00
3 min read
For feedback or concerns regarding this content, please contact us at crypto.news@mexc.com

Bitcoin is once again testing investor conviction as it fights to stay above the $110,000 level following last Friday’s sharp correction that triggered a massive leverage wipeout across the market. After one of the most volatile sessions of the quarter, traders are watching closely to see whether BTC can stabilize or if more downside pressure will emerge.

According to on-chain data shared by Darkfost, Long-Term Holders (LTHs) are continuing to exert significant pressure on the market. Their Spent Output Profit Ratio (SOPR) — a key metric tracking realized profits — currently stands at 2.32, showing that this group is selling coins at an average gain of over 130%.

Such elevated profitability levels often coincide with phases where long-term investors take profits after extended rallies, contributing to selling pressure and short-term weakness. Despite this, Bitcoin’s ability to defend its current range suggests underlying demand remains resilient.

Long-Term Holders Still Taking Profits, But Signs of Exhaustion Emerge

Analyst Darkfost points out that while the Long-Term Holders’ (LTH) SOPR currently sits at 2.32, the shorter-term averages are starting to soften. The weekly SOPR (7-day moving average) has fallen to 1.82, and the monthly SOPR (30-day) sits at 1.79, both trending downward since the summer. Although these figures remain below the annual average of 2.25, they indicate a gradual cooling of realized profits — a sign that selling pressure may be easing.

Bitcoin Long-Term Holders SOPR High or Low Profit | Source: Darkfost

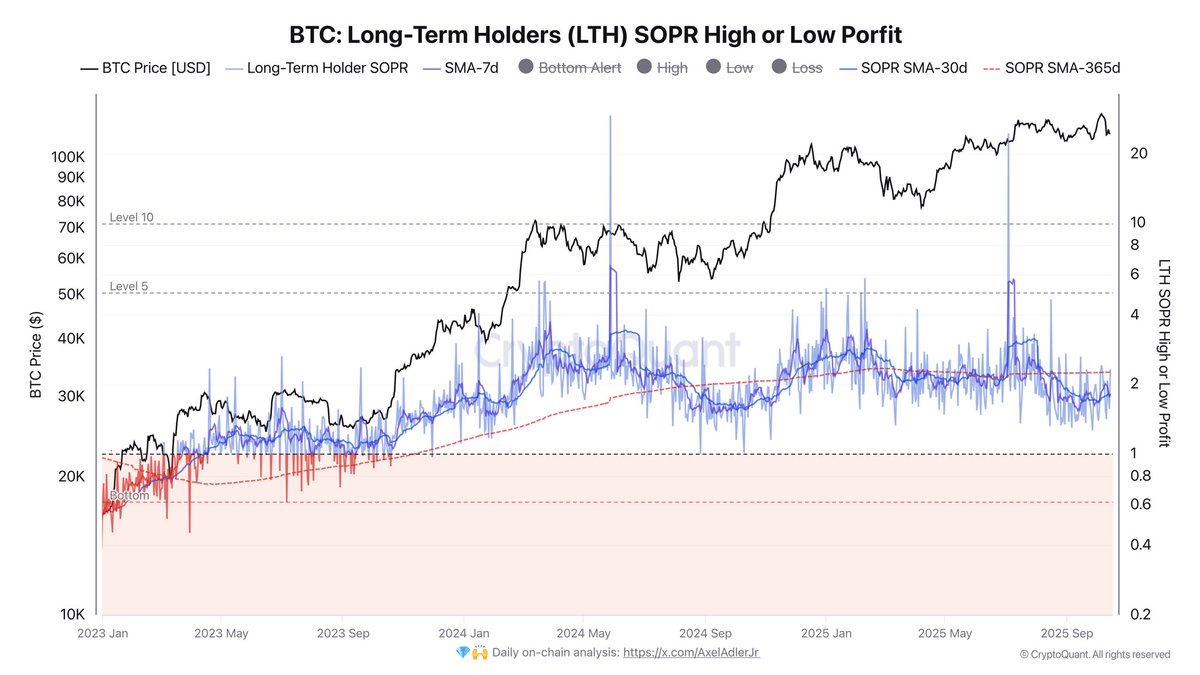
This dynamic reflects a crucial transition point for Bitcoin’s market structure. As long-term holders continue to realize profits above 1.0, they’re selling coins at a gain, effectively capping momentum and weighing on price recovery. Yet, the current decline in SOPR averages hints that this wave of profit-taking may be nearing exhaustion. Historically, such drops in realized profit levels have preceded market stabilization and, eventually, recovery phases.

Darkfost highlights that the current setup closely resembles the October 2024 correction, when Bitcoin’s SOPR bottomed near similar levels before the next major upswing. If history rhymes, the ongoing contraction in LTH profitability could signal that the worst of the correction is behind us. Still, further moderation in SOPR remains key for the market to fully reset and for sustainable upside momentum to re-emerge.

Bulls Defend $110K Zone Amid Weak Momentum

Bitcoin continues to hover around $111,500, showing signs of stabilization after last Friday’s steep sell-off. The 8-hour chart highlights a fragile recovery structure, with BTC struggling to regain key moving averages and momentum fading below the $117,500 resistance, which remains a major supply zone.

BTC struggles around low-range levels | Source: BTCUSDT chart on TradingView

The 50-day (blue), 100-day (green), and 200-day (red) moving averages are beginning to converge — a sign of compression that typically precedes a strong directional move. For now, BTC is trading below all three, suggesting that sellers still dominate the mid-term trend. Holding above $110,000 is crucial; a decisive break below could open the door to retesting the $105,000–$106,000 range, where strong demand previously emerged.

Reclaiming $114,000–$115,000 would be the first sign of strength, potentially triggering a push toward the $117,500 barrier. However, volume remains muted, implying that traders are cautious as the market digests recent volatility.

Bitcoin’s price action points to a consolidation phase, with buyers and sellers in temporary equilibrium. If bulls can protect the $110K region and momentum rebuilds, BTC could attempt a gradual recovery, but failure to do so risks extending the correction further.

Featured image from ChatGPT, chart from TradingView.com

Market Opportunity
Bitcoin Logo
Bitcoin Price(BTC)
$68,813.97
$68,813.97$68,813.97
+1.61%
USD
Bitcoin (BTC) Live Price Chart
Disclaimer: The articles reposted on this site are sourced from public platforms and are provided for informational purposes only. They do not necessarily reflect the views of MEXC. All rights remain with the original authors. If you believe any content infringes on third-party rights, please contact crypto.news@mexc.com for removal. MEXC makes no guarantees regarding the accuracy, completeness, or timeliness of the content and is not responsible for any actions taken based on the information provided. The content does not constitute financial, legal, or other professional advice, nor should it be considered a recommendation or endorsement by MEXC.

You May Also Like

Ex-White House lawyer to face House grilling over 'luxury gifts' from Epstein

Ex-White House lawyer to face House grilling over 'luxury gifts' from Epstein

The departing general counsel for Goldman Sachs is being called to Congress to testify about her apparent close professional relationship with deceased financier
Share
Rawstory2026/03/04 07:06
Gold continues to hit new highs. How to invest in gold in the crypto market?

Gold continues to hit new highs. How to invest in gold in the crypto market?

As Bitcoin encounters a "value winter", real-world gold is recasting the iron curtain of value on the blockchain.
Share
PANews2025/04/14 17:12
Whales Dump 200 Million XRP in Just 2 Weeks – Is XRP’s Price on the Verge of Collapse?

Whales Dump 200 Million XRP in Just 2 Weeks – Is XRP’s Price on the Verge of Collapse?

Whales offload 200 million XRP leaving market uncertainty behind. XRP faces potential collapse as whales drive major price shifts. Is XRP’s future in danger after massive sell-off by whales? XRP’s price has been under intense pressure recently as whales reportedly offloaded a staggering 200 million XRP over the past two weeks. This massive sell-off has raised alarms across the cryptocurrency community, as many wonder if the market is on the brink of collapse or just undergoing a temporary correction. According to crypto analyst Ali (@ali_charts), this surge in whale activity correlates directly with the price fluctuations seen in the past few weeks. XRP experienced a sharp spike in late July and early August, but the price quickly reversed as whales began to sell their holdings in large quantities. The increased volume during this period highlights the intensity of the sell-off, leaving many traders to question the future of XRP’s value. Whales have offloaded around 200 million $XRP in the last two weeks! pic.twitter.com/MiSQPpDwZM — Ali (@ali_charts) September 17, 2025 Also Read: Shiba Inu’s Price Is at a Tipping Point: Will It Break or Crash Soon? Can XRP Recover or Is a Bigger Decline Ahead? As the market absorbs the effects of the whale offload, technical indicators suggest that XRP may be facing a period of consolidation. The Relative Strength Index (RSI), currently sitting at 53.05, signals a neutral market stance, indicating that XRP could move in either direction. This leaves traders uncertain whether the XRP will break above its current resistance levels or continue to fall as more whales sell off their holdings. Source: Tradingview Additionally, the Bollinger Bands, suggest that XRP is nearing the upper limits of its range. This often points to a potential slowdown or pullback in price, further raising concerns about the future direction of the XRP. With the price currently around $3.02, many are questioning whether XRP can regain its footing or if it will continue to decline. The Aftermath of Whale Activity: Is XRP’s Future in Danger? Despite the large sell-off, XRP is not yet showing signs of total collapse. However, the market remains fragile, and the price is likely to remain volatile in the coming days. With whales continuing to influence price movements, many investors are watching closely to see if this trend will reverse or intensify. The coming weeks will be critical for determining whether XRP can stabilize or face further declines. The combination of whale offloading and technical indicators suggest that XRP’s price is at a crossroads. Traders and investors alike are waiting for clear signals to determine if the XRP will bounce back or continue its downward trajectory. Also Read: Metaplanet’s Bold Move: $15M U.S. Subsidiary to Supercharge Bitcoin Strategy The post Whales Dump 200 Million XRP in Just 2 Weeks – Is XRP’s Price on the Verge of Collapse? appeared first on 36Crypto.
Share
Coinstats2025/09/17 23:42