

Hyperliquid Price Prediction 2026: Will HYPE Hit Triple Digits?
HYPE is trading around $68.08 right now, and the chart underneath this price is worth slowing down on.
Any real Hyperliquid price prediction 2026 has to start with the rising trendline this coin has been riding since January, because that structure is what's actually driving this setup, not the day-to-day price wiggle.
Key Market Snapshot
|
Metric |
Value |
|
Coin |
Hyperliquid (HYPE) |
|
Current Price |
$68.08 |
|
Market Cap |
$15.14B |
|
24h Volume |
$410.73M |
|
Total Supply |
955,307,079 |
|
Circulating Supply |
222,445,714 |
Only about 23% of the total supply is out in the market right now, so a big chunk of future unlocks is still sitting ahead.
That's something to keep in the back of your mind even when the near-term chart looks clean.
HYPE Price Prediction 2026: The Liquidation Data
Looking at the liquidation data, $HYPE saw $3.14M in total liquidations over the past 24 hours, and most of that, close to 75%, came from long positions getting wiped out during a pullback.
That lines up with the recent dip in price.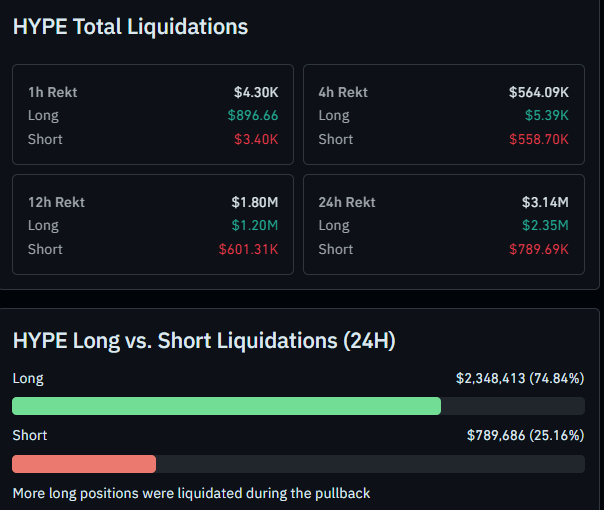
But zoom into the shorter windows, and the picture flips. In the last 4 hours, shorts took the bigger hit, losing $558.70K against just $5.39K on the long side.
Even in the last hour, shorts got squeezed again, losing $3.40K compared to under $900 on longs.
That's a meaningful shift. The 24-hour picture shows longs getting flushed during the drop, but the most recent hours show sellers getting caught out as the price tries to stabilize and bounce back.
That kind of flip usually shows up right around a level the market is fighting over.
Whale Activity: Institutions Are Paying Attention
As per Whalefactor on X, there's real institutional interest building here too.
Bitwise recently added HYPE to its BITW 10 Crypto Index ETF, placing it in the same basket as Bitcoin and Ethereum.
This isn't just a mention on social media; it's an index inclusion, which means real passive capital now has exposure to HYPE by default.
Hyperliquid has led on-chain volume for months, and this kind of recognition from a major asset manager adds real weight to the case that this isn't just retail speculation anymore.
Hyperliquid Price Prediction 2026: Technical Forecast
Here's the structure that actually matters. On the daily chart, HYPE has been climbing off a rising trendline since January 2026, and every time price comes back down to test that line, it finds support and bounces.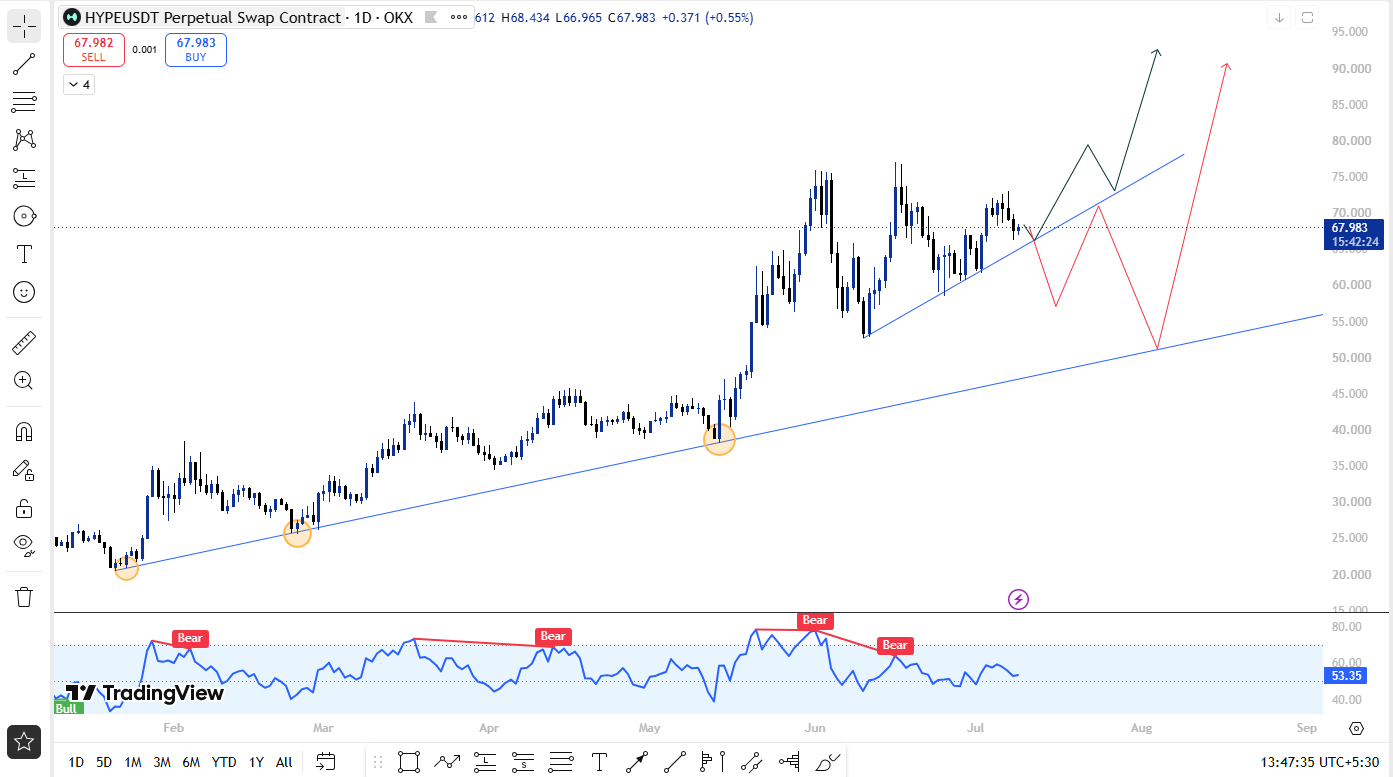
There have been three clear taps on this trendline so far, and each bounce has led to a higher high than the one before it.
That's a textbook sign of an uptrend that keeps building on itself rather than losing steam.
RSI right now sits around 53, which is neutral. It's not overbought, and it's not oversold either; there's plenty of room left for price to move in either direction without hitting an extreme reading first.
Hyperliquid Price Prediction 2026: What Happens If This Breaks Higher
If HYPE keeps respecting this main trendline and starts building liquidity around current levels.
The setup points toward using that trendline as a launchpad for a fresh push higher, aiming to clear the record high near $76.70 and print a new all-time high from there.
There's also a backup plan built into this chart. A smaller, steeper trendline formed back in June 2026, sitting above the main one.
If the primary trendline ever gets tested and price dips through it, this second trendline is the next line of defense.
Either way, the broader structure stays bullish. One path takes support from the main trendline, and the other takes support from the smaller one, but both scenarios point toward an eventual breakout above the old high.
Hyperliquid Price Prediction 2026: What Happens If Selling Continues
The other side of this setup still needs watching.
If HYPE loses both the main trendline and the smaller backup trendline formed in June, with weak liquidity behind the move, that would be the clearest sign the current uptrend structure is breaking down.
In that case, price would likely need to find a fresh base lower down before any new attempt at breaking the record high.
Hyperliquid Forecast 2026: Bullish vs Bearish Scenarios
Bullish Scenario: HYPE holds its main trendline, builds liquidity around current levels, and pushes toward a new all-time high above $76.70, using either the main trendline or the smaller June trendline as support along the way.
Bearish Scenario: HYPE loses both trendlines with weak liquidity behind the move, forcing price to find a new base before any fresh attempt at breaking the record high.
Where the odds sit: With three straight higher highs off the main trendline, RSI still neutral at 53, and fresh institutional attention from the Bitwise index inclusion, the setup leans bullish for now. But this is still an unconfirmed structure, and every level here should be treated as a probability, not a certainty.
Invalidation: This is a technical read based on current chart structure, not a guarantee. Liquidation-driven swings can move fast in either direction, so every level in this HYPE price prediction 2026 breakdown should be treated with caution.
Disclaimer: Cryptocurrency investments carry risk and can be highly volatile. This HYPE Price Prediction 2026 article is intended for informational purposes only and should not be considered financial advice. Always conduct independent research before making investment decisions.


You May Also Like

The Chemistry of UV Resistance: How Titanium Dioxide Protects Against the California Sun

Avalanche Treasury Firm AVAX One Reclaims Nasdaq Compliance After Reverse Stock Split

With SEC fight over, Coinbase's top legal exec Grewal moves on, and others reassigned



