

Ethereum (ETH) Bulls Have One Last Obstacle Before a Bigger Price Move Can Begin
Ethereum has reached one of its most important technical moments in recent weeks. The ETH price is testing a resistance zone around $1,796, and the next move could determine whether buyers regain control or sellers keep the market trapped below $2,000. Several technical indicators now point to the same group of price levels, which makes the current setup more interesting than an ordinary resistance test.
Recent price action shows Ethereum pressing against multiple barriers at the same time. A successful breakout could improve the bullish outlook considerably. Failure to clear those levels could leave the ETH price inside its current trading range for longer.
Ethereum is currently testing the 0.8 MVRV Pricing Band near $1,796, which has become one of the most important resistance levels on the chart. A daily close above this level would improve the technical picture. Buyers would then need to defend that same area as support before a stronger recovery becomes more likely.
The importance of this zone comes from the fact that several technical tools point to nearly the same price area. The TD Sequential resistance trendline also sits around $1,796, creating the first obstacle for the ETH price.
Another hurdle appears slightly higher at $1,816, where the TD Sequential risk line currently stands. A move above both resistance levels would remove two important technical barriers that have limited Ethereum’s recent recovery attempts.
Another challenge still remains after that. The upper boundary of the current trading channel stands near $1,844. A breakout above that level would strengthen the bullish case and increase the probability of Ethereum climbing toward its Realized Price around $2,245.
Those resistance levels form a clear roadmap. Ethereum first needs to reclaim $1,796, then move above $1,816, and finally break through $1,844 before the market can seriously discuss a return toward the $2,245 region.
Ethereum Price Continues Trading Inside a Well-Defined Range
Recent Ethereum price action shows the market moving mostly between $1,741 and $1,834 for several days. Buyers have defended the lower part of this range on several occasions, although they have not managed to produce a convincing breakout above resistance.
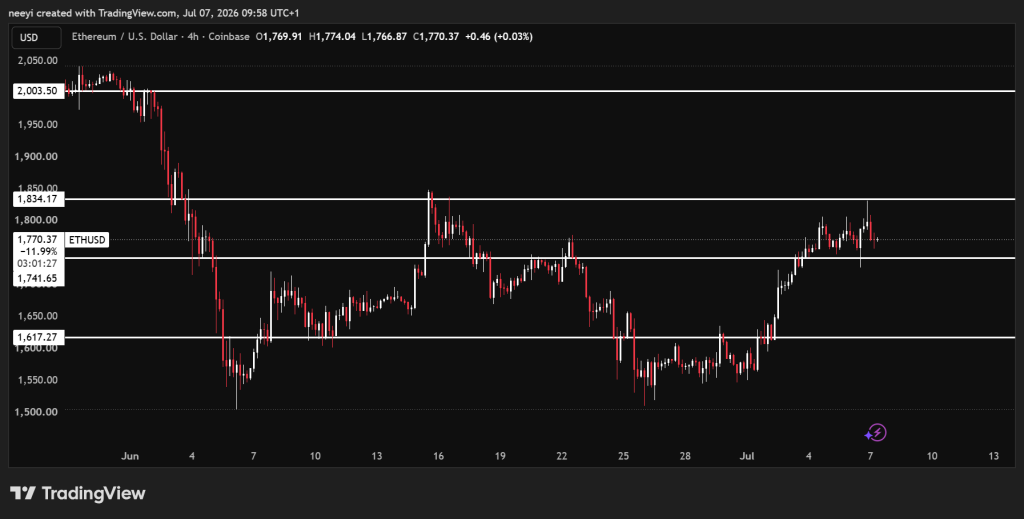 ETH Price Chart / TradingView.com
A move above $1,834 would represent an important technical victory for buyers. That breakout could push the ETH price back into the $2,000 region. The size of any recovery would still depend on overall market conditions and whether bullish momentum continues after the breakout.
The opposite scenario also deserves attention. A decline below the $1,700 level would weaken Ethereum’s technical structure and could extend the recent period of price weakness. Such a move would indicate sellers have regained greater control of the market.
Current technical indicators still lean slightly toward the bearish side despite the bullish breakout setup. That combination creates an interesting situation because price sits close to major resistance even though momentum indicators have not fully turned positive yet. Extra caution may therefore be appropriate until Ethereum clears the resistance cluster discussed earlier.
Ethereum Technical Indicators Show Momentum Has Not Fully Recovered Yet
The Relative Strength Index (RSI) currently stands at 49.201. That reading places momentum almost exactly in the middle of its range. Buyers and sellers remain closely matched, although neither side has established a clear advantage.
The Stochastic Oscillator reads 25.674. That level shows buying strength remains limited after recent price weakness. Stronger upward momentum would become more convincing if this indicator begins moving higher alongside price.
Read Also: Demand for XRP Is Coming from Every Angle: $4B in Assets, ETF Inflows, and New Wallets
The MACD currently stands at -0.55. That negative reading shows bearish momentum has not completely faded even though Ethereum continues testing resistance.
The Ultimate Oscillator comes in at 43.616. This reading points to moderate weakness across multiple timeframes and supports the cautious outlook.
Bull Bear Power stands at 0.042, which offers one encouraging sign. Buyers still maintain a slight advantage despite the mixed picture shown by the other indicators.
| Name Of Indicator | Metrics | Interpretation Of Metrics |
|---|---|---|
| Relative Strength Index (14) | 49.201 | Momentum remains balanced without a clear directional advantage. |
| Stochastic (9,6) | 25.674 | Buying strength remains limited after recent weakness. |
| MACD (12,26) | -0.55 | Bearish momentum still has some influence over price action. |
| Ultimate Oscillator | 43.616 | Momentum remains slightly weak across multiple timeframes. |
| Bull Bear Power (13) | 0.042 | Buyers hold a small advantage despite mixed technical conditions. |
Ethereum Price Prediction: Where Could ETH Go Next?
- Bullish Scenario: A daily close above $1,796, followed by a move above $1,816 and $1,844, would strengthen the bullish outlook. That sequence could allow the ETH price to return to the $2,000 region before a possible move toward $2,245.
- Neutral Scenario: Ethereum could continue trading between $1,741 and $1,834 if buyers fail to break resistance and sellers cannot force a move below support.
- Bearish Scenario: A decline below $1,700 would weaken the current technical structure and could extend Ethereum’s recent struggles before buyers attempt another recovery.
FAQs
Subscribe to our YouTube channel for daily crypto updates, market insights, and expert analysis.
The post Ethereum (ETH) Bulls Have One Last Obstacle Before a Bigger Price Move Can Begin appeared first on CaptainAltcoin.


You May Also Like

Gold Holds Near Daily Lows as Rising Yields and Firm Dollar Offset Geopolitical Tensions

Top U.S. economist says Gold reversal is imminent

Hesab Selects Movement as Exclusive Stablecoin Settlement Layer for Its Global Self-Custody Bank



