

Nike Stock Bounces Off 52-Week Low — but $44.76 Resistance Looms

Nike Stock sits at a critical juncture after recovering from near its 52-week low around $40. NKE closed at $44.09, but overhead resistance raises serious questions about whether this bounce marks a genuine reversal.
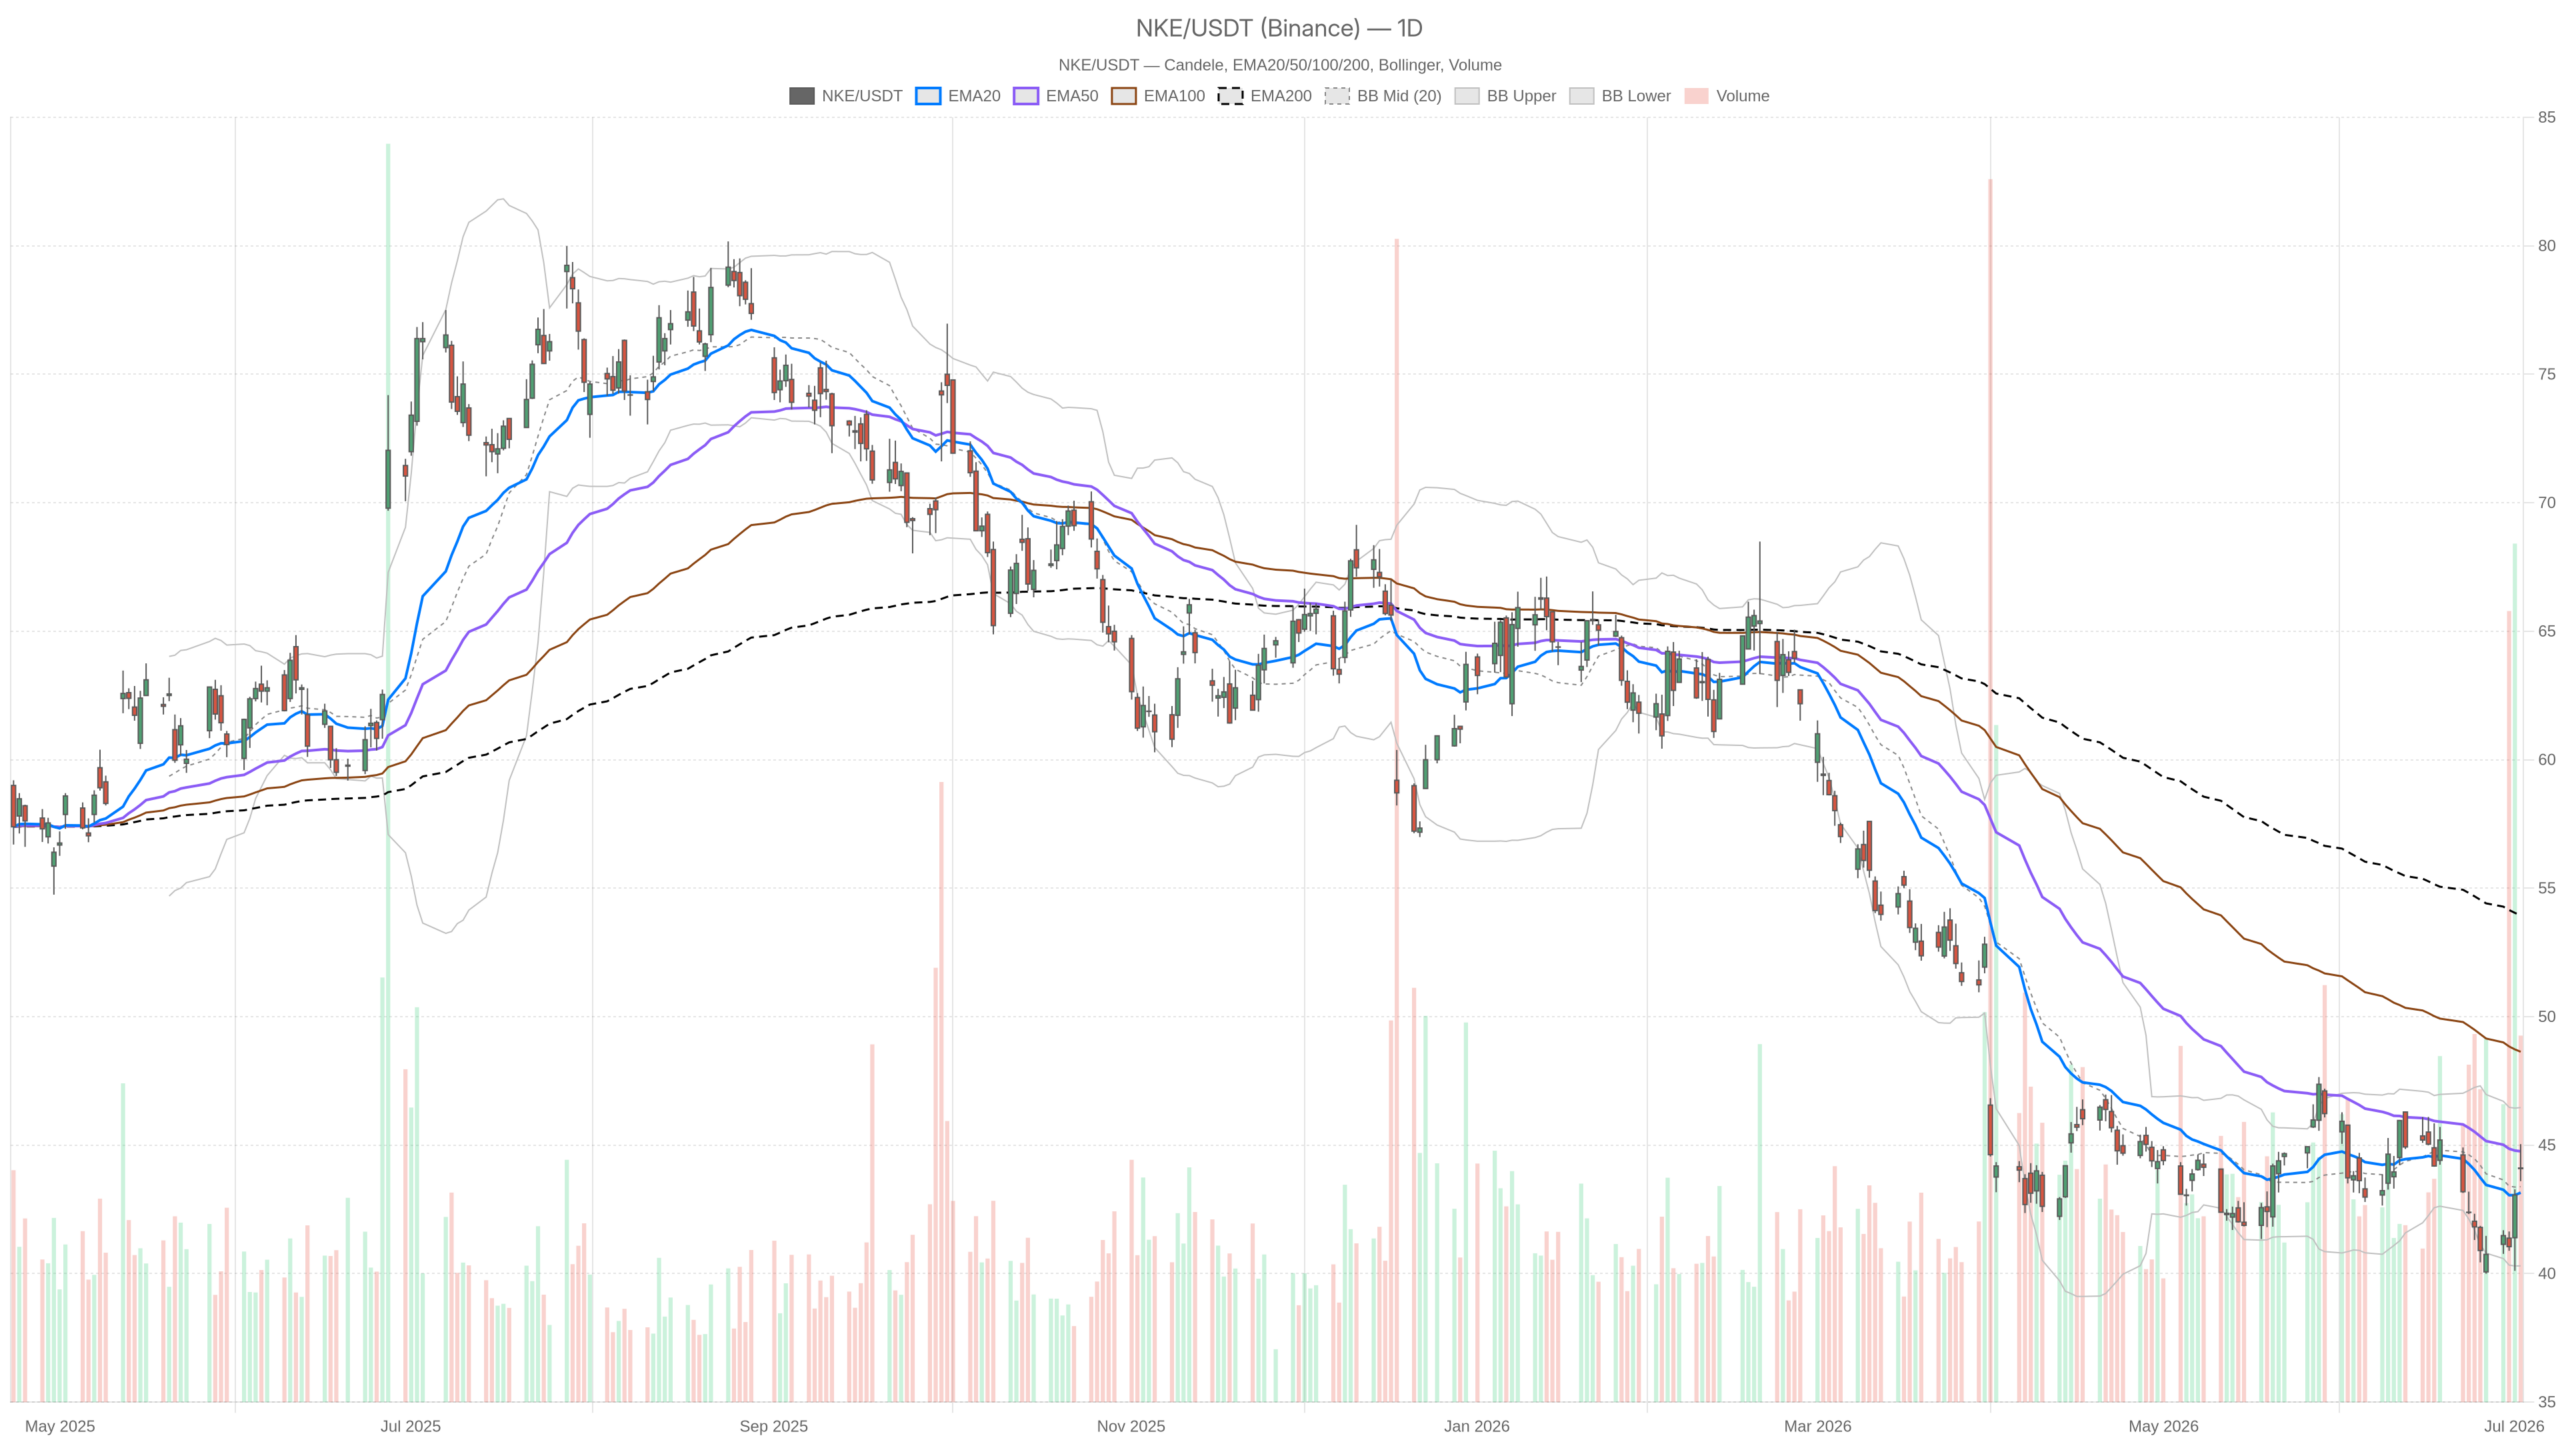 NKE — daily chart with candlesticks, EMA20/EMA50 and volume.
Key takeaways
- Nike Stock closed at $44.09, recovering from near its 52-week low but remaining below key daily resistance levels.
- The daily EMA50 at $44.76 acts as an overhead cap, with the EMA200 far above at $53.94 underscoring structural damage.
- Hourly momentum is bullish across all three EMAs, creating a notable divergence from the still-damaged daily structure.
- The daily MACD remains negative but is converging, hinting at possible momentum exhaustion rather than a confirmed reversal.
- Legal uncertainty and a broken long-term trend keep the bearish case active until NKE clears $44.76 on a closing basis.
What Is the Daily Technical Picture for Nike Stock?
Nike Stock’s daily chart shows a fragile, neutral-to-bearish structure. Price sits above the EMA20, yet below the EMA50 and EMA200. Momentum indicators suggest selling pressure is merely exhausting — not reversing with conviction.
EMA Structure and Trend Context
Price trades above the EMA20 at $43.15, which offers mild encouragement. The EMA50 at $44.76, however, acts as an overhead cap. Meanwhile, the EMA200 at $53.94 sits far above — a sobering reminder of accumulated structural damage. Nike Stock is not recovering on the daily chart. It is surviving.
Momentum and Volatility Signals
The daily MACD line at -0.61 is converging toward the signal line at -0.60. The histogram of -0.01 hints at fading selling pressure. Yet no bullish crossover has materialized — only the early suggestion that momentum is bottoming. RSI at 52.93 sits just above neutral, neither overbought nor oversold.
Bollinger Bands place price near the midband at $43.38. The upper band stands at $46.47 and the lower at $40.30. With ATR at 1.48, daily swings of roughly 3.3% remain the norm. The daily pivot sits at $44.24. NKE closed at $44.09 — a marginal failure to hold pivot support that keeps the short-term bias slightly defensive.
Is Intraday Momentum Sending a Different Signal?
The most compelling part of Nike Stock’s current setup is the divergence between daily and intraday charts. The 1-hour timeframe tells a notably more constructive story, though shorter-term caution flags are already appearing.
1-Hour Chart vs. Daily Chart
On the H1 chart, price trades above all three key EMAs. The EMA20 sits at $42.99, the EMA50 at $42.59, and the EMA200 at $43.42 — a clean bullish EMA stack. The hourly MACD is positive, with the line at 0.66 above the signal at 0.50 and a histogram of 0.16. This is genuinely constructive momentum.
However, hourly RSI at 67.52 is approaching overbought territory. This level often precedes short-term consolidation or mild pullbacks. The intraday rally looks stretched relative to where the daily trend actually stands — a nuance worth watching closely.
On the 15-minute chart, the regime reads as bullish — the only explicitly bullish reading across all timeframes. Price sits above short-term EMAs, with RSI at 58.79. Yet the MACD histogram has flipped slightly negative at -0.04. This is an execution-level caution flag, warning against chasing entries on the current push without confirmation.
What Fundamental Factors Are Shaping the Outlook?
The fundamental backdrop complicates Nike Stock’s technical picture. The Q4 report offered glimmers of hope — enough to spark a post-earnings bounce — yet skepticism remains widespread. One major market continues to underperform. A federal lawsuit threatens one of Nike’s most anticipated sneaker launches this summer. Meanwhile, Jim Cramer publicly acknowledged cutting NKE from his Charitable Trust portfolio. These are not the headlines of a company confidently regaining its footing.
On the other hand, at least one prominent forecast projects a 25% rebound from the $41 level. A 12-month price target near $51 is not unreasonable given the scale of the sell-off. At current prices, much of the bad news may already be priced in. The question remains whether a catalyst exists to unlock that upside in the near term.
Bullish and Bearish Scenarios for Nike Stock
Nike Stock sits at a crossroads where both paths carry meaningful weight. The intraday momentum is constructive, but daily structure remains damaged and overhead resistance is significant. Volatility ensures moves in either direction will not be gentle.
The Bullish Case
If NKE clears and holds the daily EMA50 at $44.76, the structure would shift meaningfully. A close above the daily R1 at $44.89 would confirm that bulls are pressing through near-term resistance. The Bollinger upper band at $46.47 then becomes the next logical target. Sustained hourly momentum could help bridge that gap. Positive legal developments or improving key-market data could accelerate the move.
The Bearish Case
In contrast, a failure to reclaim the daily pivot at $44.24 would quickly put S1 at $43.45 back in play. Combined with hourly RSI retreating from the 67 area, the bearish pressure would intensify. Below that, the lower Bollinger Band at $40.30 — just above the 52-week low — becomes the gravitational target. The daily MACD, still barely negative, could easily re-diverge downward. Legal uncertainty, execution risk, and the broken long-term EMA structure all argue that the path of least resistance remains lower until proven otherwise.
FAQ
Is Nike Stock a buy at current levels?
Nike Stock at $44.09 sits in a technically ambiguous zone. The daily structure remains damaged below the EMA50, and no bullish MACD crossover has confirmed a reversal. The hourly chart is constructive but approaching overbought levels. A confirmed close above $44.76 would strengthen the bullish case significantly.
What is the next major resistance level for NKE?
The daily EMA50 at $44.76 is the immediate test. Above that, the daily R1 at $44.89 and the Bollinger upper band at $46.47 form the next resistance cluster. The EMA200 at $53.94 represents the long-term structural barrier that would need to be overcome for a full trend reversal.
What risks could push Nike Stock lower?
Several risks weigh on Nike Stock. A federal lawsuit threatens a key summer sneaker launch. One major market continues to underperform. The daily trend structure remains broken below the EMA50. A failure to hold the daily pivot at $44.24 could send price toward S1 at $43.45, with the lower Bollinger Band at $40.30 as the deeper downside target.
Disclaimer: This article is for informational purposes only and does not constitute financial advice, an investment recommendation, or a solicitation to buy or sell any financial instrument or cryptocurrency. The analysis provided is not indicative of future results. Investing in crypto assets and financial markets carries a high risk of capital loss. Always do your own research (DYOR) and consult a qualified financial advisor before making any decision.
Article produced with the assistance of artificial intelligence and reviewed by the editorial team.


You May Also Like
Bitcoin Price News: BTC Price Holds Above $62K Even After Strategy Sold $216 Million Worth of Bitcoin

JPMorgan sends blunt verdict on oil, economy

Circus Appoints Former Aviation and Automotive Executive as Co-CEO and CFO



