

Bitcoin Price Today: $62,900 After 21-Month Low — Bottom or Trap?

As of July 6, 2026, the Bitcoin price today hovers near $62,904 — deceptively calm but sitting at the intersection of competing forces far from settled. BTC hit a 21-month low just days ago, falling below the 200-week moving average. What we’re now watching is a fragile stabilization that could break either direction.
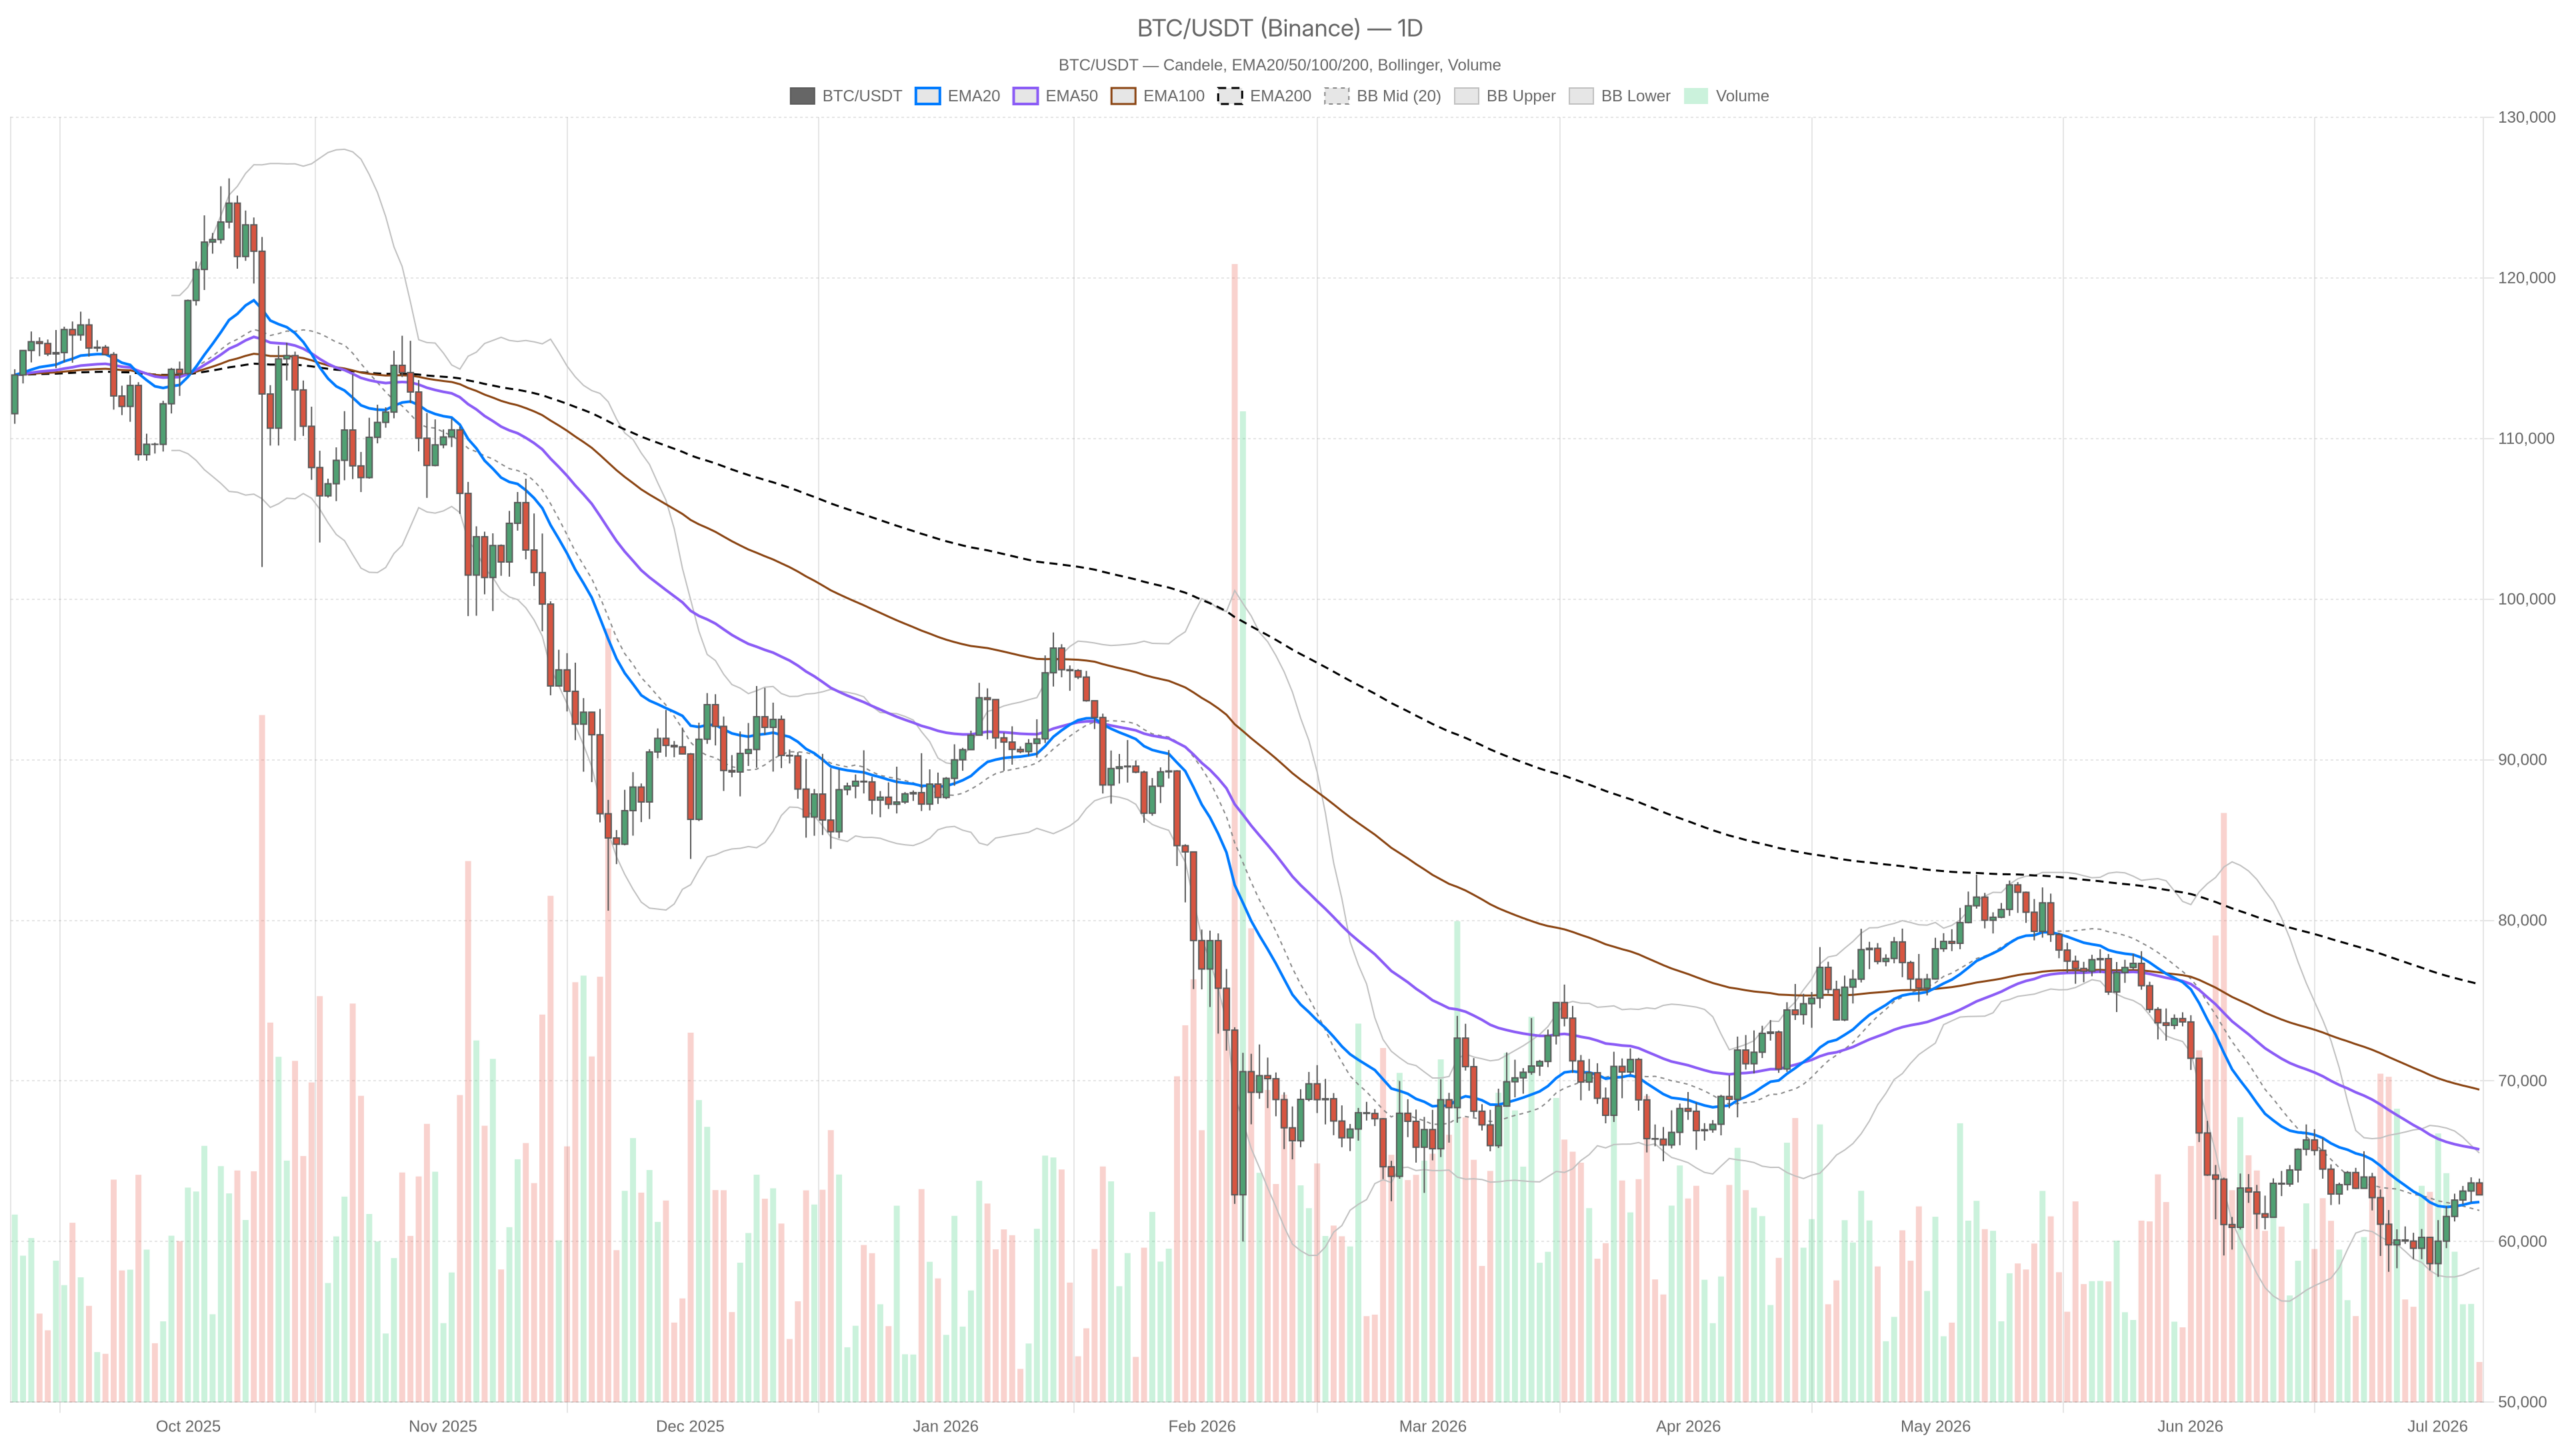 BTC/USDT — daily chart with candlesticks, EMA20/EMA50 and volume.
Key takeaways
- Bitcoin trades at $62,904, caught between short-term recovery signals and medium-term bearish pressure on the daily chart.
- The daily EMA50 at $65,738 and EMA200 at $76,019 remain far above current price, confirming the structural downtrend.
- Daily MACD histogram has turned positive while the hourly MACD shows a bearish cross in motion, creating a multi-timeframe conflict.
- The Fear & Greed Index at 24 (Extreme Fear) historically appears near major bottoms but can persist for weeks.
- Bitcoin dominance at 55.7% with substantial stablecoin sidelined capital keeps both recovery and breakdown scenarios viable.
Adding complexity to the macro picture, JPMorgan flagged that Michael Saylor’s Strategy has introduced new structural risk into the Bitcoin market. CNBC described this as creating a unique trade as Bitcoin’s summer slump deepens. German savings banks reportedly pushing into crypto trading may provide a slow-burn institutional bid.
However, that kind of demand does not move prices in a week. For now, the dominant market force is uncertainty. The Fear & Greed Index sitting at 24 in Extreme Fear confirms that sentiment has not found a bottom yet.
The Daily Chart: Damaged but Not Destroyed
On the daily timeframe, according to Binance market data, the regime is flagged as neutral. Neutral here means indecisive — caught between the wreckage of a downtrend and a not-yet-convincing recovery attempt.
The EMA stack tells the real story. Price at $62,904 sits barely above the EMA20 at $62,459 but remains comfortably below the EMA50 at $65,738 and dramatically below the EMA200 at $76,019. Short-term momentum is marginally positive, yet the medium and long-term trend is firmly bearish. Reclaiming the EMA50 is necessary before anyone can credibly talk about a trend reversal.
Meanwhile, the daily RSI at 48.83 straddles the neutral midpoint, technically not oversold. That means there is no automatic mean-reversion fuel here. This market needs fresh buyers, not just short-covering, and the RSI print does not suggest they have arrived in force.
The MACD on the daily sits in negative territory at -1,045 on the line, but the histogram has flipped positive at +656. That divergence between the still-negative MACD line and the recovering histogram is the most constructive signal on this timeframe. The downward momentum is decelerating.
It does not call a bottom, but it does suggest the selling pressure that drove price into the $58K–$60K range has eased. Watch whether the MACD line can cross above the signal line at -1,701. That would confirm the deceleration is becoming an actual shift.
Moreover, the Bollinger Bands on the daily have the midline at $61,935 and the upper band at $65,510. Price sits between the mid and upper band — a position that in a downtrend typically signals a corrective rally rather than a new leg up. The lower band at $58,359 is where real pain would resume if support breaks. ATR at $2,215 signals this market can move hard when it decides to.
The daily pivot is at $63,242, with R1 at $63,581 and S1 at $62,565. Bitcoin closed just below its own daily pivot point — a subtle but meaningful detail. It is not catastrophic, but it means the price action is leaning defensively rather than offensively.
The Hourly Frame: Where the Tension Lives
On the 1H chart, the picture gets more nuanced. The EMA200 on this timeframe sits at $61,676 — well below current price — which is actually constructive and provides a meaningful support cushion. The EMA50 at $62,847 and current price near $62,906 are essentially glued together, suggesting short-term equilibrium rather than directional conviction.
What is more telling is the hourly MACD: the histogram has turned negative at -42.89, even as the line stays barely positive at +89. The signal line at $132 now sits above the MACD line — a bearish cross in motion. This directly contradicts the positive daily MACD histogram, creating a multi-timeframe conflict that traders need to respect.
The daily says deceleration of selling; the hourly says fresh near-term selling pressure is building. Both can be right simultaneously, and that tension produces choppy, low-conviction price action. The 1H RSI at 45.61 leans slightly bearish without being oversold.
Essentially, the hourly frame is rolling over from a position that never managed to build real bullish momentum. The Bollinger midband at $63,075 sits just above price. Bitcoin needs to reclaim and hold that level to stabilize the short-term bias.
The 15-Minute Frame: Execution Context Only
The 15M chart is showing stress. RSI at 35.86 is approaching oversold levels, and the MACD sits in clear negative territory with a bearish histogram reading at -39.15. Price is below all three short-term EMAs — EMA20 at $63,178, EMA50 at $63,190, and EMA200 at $62,872. Only the EMA200 on this timeframe offers nearby support just below current price.
For anyone looking at entries, the 15M is flashing short-term exhaustion in the selling. However, approaching oversold is not the same as being at oversold. The Bollinger lower band at $62,882 nearly touches price, meaning a temporary bounce is technically plausible. That is a tactical observation, not a directional one.
The Bullish Case
For bulls to take control, Bitcoin needs to reclaim the daily pivot at $63,242, hold it, and then push through R1 at $63,581. Above that, the EMA50 on the daily at $65,738 becomes the real test — the level separating a corrective bounce from a legitimate recovery.
A reclaim of the EMA50 with volume would mark a significant structural shift. The daily MACD histogram turning more aggressively positive and the hourly MACD executing a clean bullish cross would reinforce that scenario. Moreover, a Fear & Greed recovery above 40 would signal that retail capitulation is reversing.
This scenario is invalidated if price fails at the pivot area repeatedly or rolls over through $62,565 without a defense.
The Bearish Case
The bear case is straightforward but serious. A daily close below $62,565 puts the Bollinger lower band at $58,359 back in play. Given that Bitcoin just came off a 21-month low, the market has already shown it can reach levels many considered unlikely.
Furthermore, the hourly MACD bearish cross combined with flat-to-negative RSI readings across timeframes means the path of least resistance short-term remains down. If the macro environment deteriorates further — rate-hike fears or a Strategy-related forced selling event — there is very little technical support between $62,000 and $60,000.
This scenario is invalidated if price holds daily S1 with strength and closes back above the pivot on consecutive sessions.
Positioning and Risk Context
The ATR at $2,215 daily means volatility is not low — it is just quiet relative to what it could be. Anyone sizing positions based on tight stops will get shaken out repeatedly in this environment. The broader market cap is essentially flat on a 24-hour basis, down just 0.035% per CoinGecko data.
Meanwhile, Bitcoin dominance at 55.7% shows that capital has not fled to altcoins. It is either sitting in stablecoins or leaving crypto entirely. USDT’s 8.1% share of total market cap reinforces that picture: sideline cash is substantial, which can fuel a recovery or signal persistent distrust.
The Bitcoin price today reflects deep structural uncertainty — and the extreme fear reading of 24 historically appears near major bottoms. However, near can mean weeks away, and catching a falling knife in extreme fear rarely ends cleanly. The setup right now rewards patience over aggression.
What this market needs most before any sustained move higher is time to build a base and consolidate above the current range floor. Let the MACD on the daily complete its potential bullish cross. Until that happens, this is a market to watch very carefully, not one to chase.
FAQ
What is Bitcoin’s current price and key support level?
Bitcoin is trading at approximately $62,904 as of July 6, 2026. The nearest key support sits at the daily S1 level of $62,565, with the more critical floor at the Bollinger lower band of $58,359 — a level that would come back into play if current support fails.
Is Bitcoin in a bear market right now?
On the daily timeframe, the trend remains structurally bearish. Price sits well below both the EMA50 at $65,738 and the EMA200 at $76,019, and BTC recently hit a 21-month low while briefly falling below the 200-week moving average — a threshold long treated as the last line of defense in secular bull markets.
What needs to happen for Bitcoin to turn bullish?
Bitcoin needs to reclaim the daily pivot at $63,242 and the EMA50 at $65,738 with volume. A bullish MACD cross on the daily combined with a Fear & Greed Index recovery above 40 would provide confirmation. Until the EMA50 is reclaimed, every bounce remains just a bounce within a downtrend.
Why is the Fear & Greed Index at 24 significant?
Extreme Fear readings historically appear near major market bottoms, often preceding strong recoveries. However, the index can remain in extreme fear territory for weeks, and it does not provide precise timing. The current reading of 24 confirms that sentiment has not yet found a floor.
&&
Disclaimer: This article is for informational purposes only and does not constitute financial advice, an investment recommendation, or a solicitation to buy or sell any financial instrument or cryptocurrency. The analysis provided is not indicative of future results. Investing in crypto assets and financial markets carries a high risk of capital loss. Always do your own research (DYOR) and consult a qualified financial advisor before making any decision.
Article produced with the assistance of artificial intelligence and reviewed by the editorial team.


You May Also Like
Dow Jones Industrial Average Flirts With Historic Milestone Before Pulling Back

Was Michael Burry Right About Palantir? PLTR Is Still Down Over the Past Year

MAGA melts down as Bruce Springsteen torches Trump in new interview: 'He is a coward'



