

Solana (SOL) Price Faces Critical Test as Goldman Sachs Exits and Pump.fun Offloads Tokens
Key Takeaways
- Solana is currently priced around $82.61, retreating from May highs above $95.
- Critical support zone identified at $78.17; breach could trigger decline toward $58.
- Pump.fun liquidated more than 100,000 SOL tokens around $84.50, intensifying supply dynamics.
- Goldman Sachs eliminated its Solana ETF holdings, dampening institutional sentiment.
- Futures market indicators reveal declining volume and open interest, signaling trader hesitation.
Solana (SOL) continues to trade near a pivotal support threshold following a double-digit percentage drop from its monthly peak. The digital asset has encountered substantial headwinds from whale distributions, waning institutional participation, and negative sentiment across cryptocurrency markets.
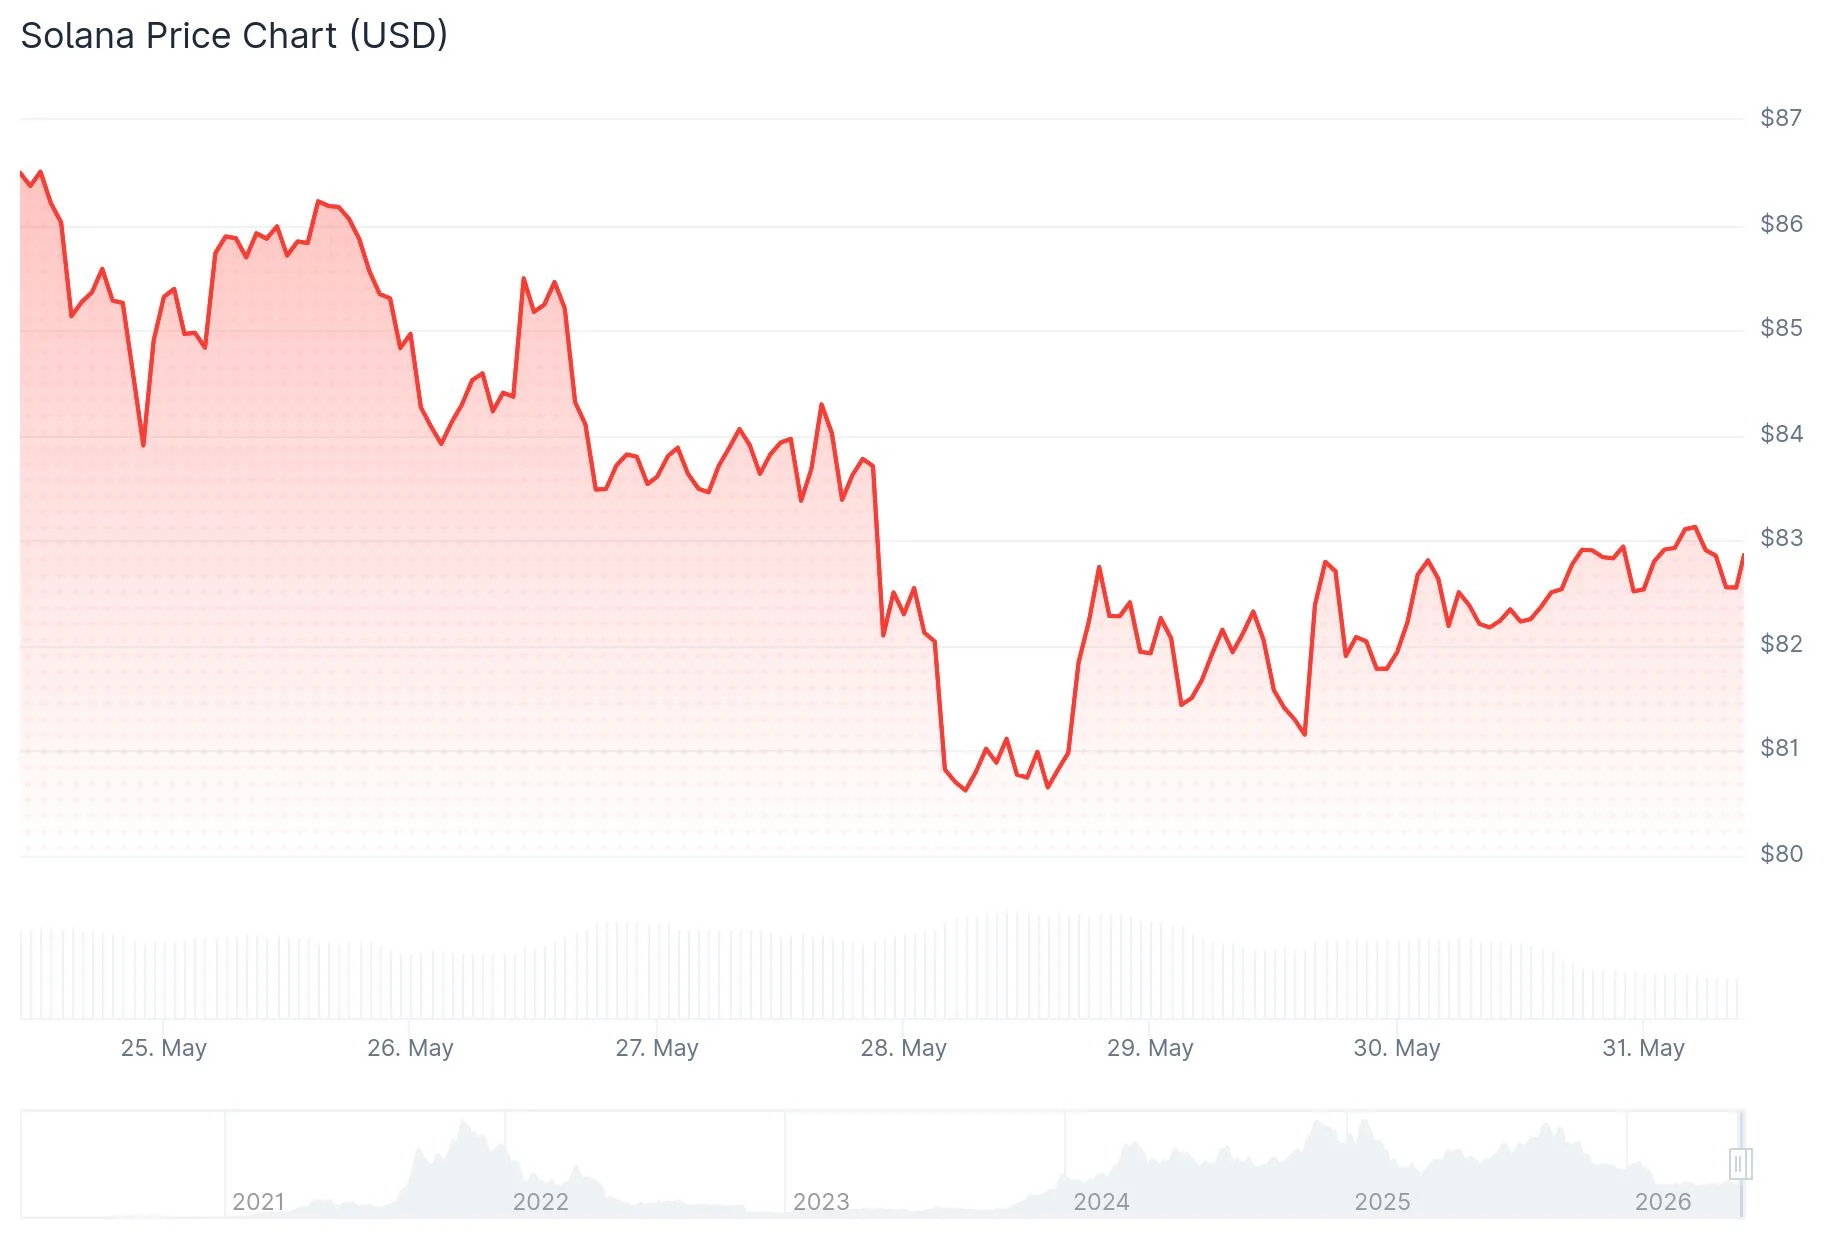 Solana (SOL) Price
At press time, SOL was changing hands at $82.61, registering a 24-hour trading volume of $3.10 billion alongside a market capitalization of $47.79 billion, per CoinMarketCap data. The token recorded a marginal 0.28% uptick over the previous day.
On May 30, cryptocurrency analyst Ali Martinez highlighted $78.17 as the pivotal support threshold traders should monitor. Martinez noted that maintaining price action above this zone could enable SOL to challenge the $87 resistance area. Conversely, failing to defend this level might accelerate downside movement toward $58.
Earlier in May, SOL was exchanging above the $95 mark before encountering resistance. A classic bearish double top configuration emerged around $98, with price rejections occurring in both March and May. This technical development positioned the $80 region as a focal point for market participants.
Selling pressure intensified approximately on May 28 when Pump.fun reactivated its treasury liquidation strategy after an extended dormant period. Blockchain analytics from Lookonchain revealed the platform offloaded approximately 100,628 SOL at an average execution price of $84.50. Concurrently, a veteran holder liquidated nearly $137.7 million in SOL holdings.
Waning Institutional Appetite
Recent regulatory filings indicate Goldman Sachs completely divested its Solana ETF position during the latest reporting window. Net inflows into spot Solana exchange-traded funds have decelerated across multiple U.S. offerings, with prominent asset managers scaling back cryptocurrency allocations in recent weeks.
Broader digital asset markets experienced concurrent weakness. Bitcoin retreated below the $73,000 threshold while Ethereum dropped beneath $2,000, movements partially attributed to escalating geopolitical friction between the United States and Iran. Elevated energy prices and international uncertainty suppressed investor appetite for speculative assets.
According to CoinGlass analytics, liquidation concentration zones formed near the $83, $84, and $88 price levels. SOL’s failure to reclaim these thresholds activated stop-loss orders and accelerated downward momentum. Open interest in Solana perpetual futures contracts declined as market participants unwound leveraged long positions instead of establishing fresh exposure.
Futures Market Reflects Uncertainty
Derivatives metrics underscore prevailing market caution. Open interest contracted 2.12% to $5.35 billion, while trading volume plummeted 39.16% to $4.81 billion. Reduced position openings and widespread closing of existing contracts characterize current activity.
The OI-weighted funding rate maintains a marginally positive reading at 0.0064%, indicating residual optimism among certain participants. However, trading collective AltCryptoGems identified $88 as a converted resistance barrier and cautioned about potential movement toward $76 should sellers maintain dominance.
SOL continues trading beneath its 50-day moving average positioned near $86.50. Each recovery attempt since late April has established progressively lower peaks, validating a deteriorating rebound structure on daily timeframes.
The $78.17 support threshold identified by analyst Ali Martinez represents the critical battleground for SOL’s immediate price trajectory.
The post Solana (SOL) Price Faces Critical Test as Goldman Sachs Exits and Pump.fun Offloads Tokens appeared first on Blockonomi.


You May Also Like
Data Analyst to XRP Investors: Save This Tweet. Time Will Reveal the Truth

DOT Price Prediction: $1.15 Support Break Imminent Within 7 Days

'This is so cringe': GOP lawmaker meets MAGA rage after 'thirsty' post about Trump



