

Unitedhealth Group Inc Holds as 390–398 Becomes the Key Zone

Unitedhealth group inc (UNH) holds a strong daily uptrend, while short-term momentum cools into the 390–398 decision zone. The base case stays bullish, yet near-term price action favors consolidation before the next directional move.
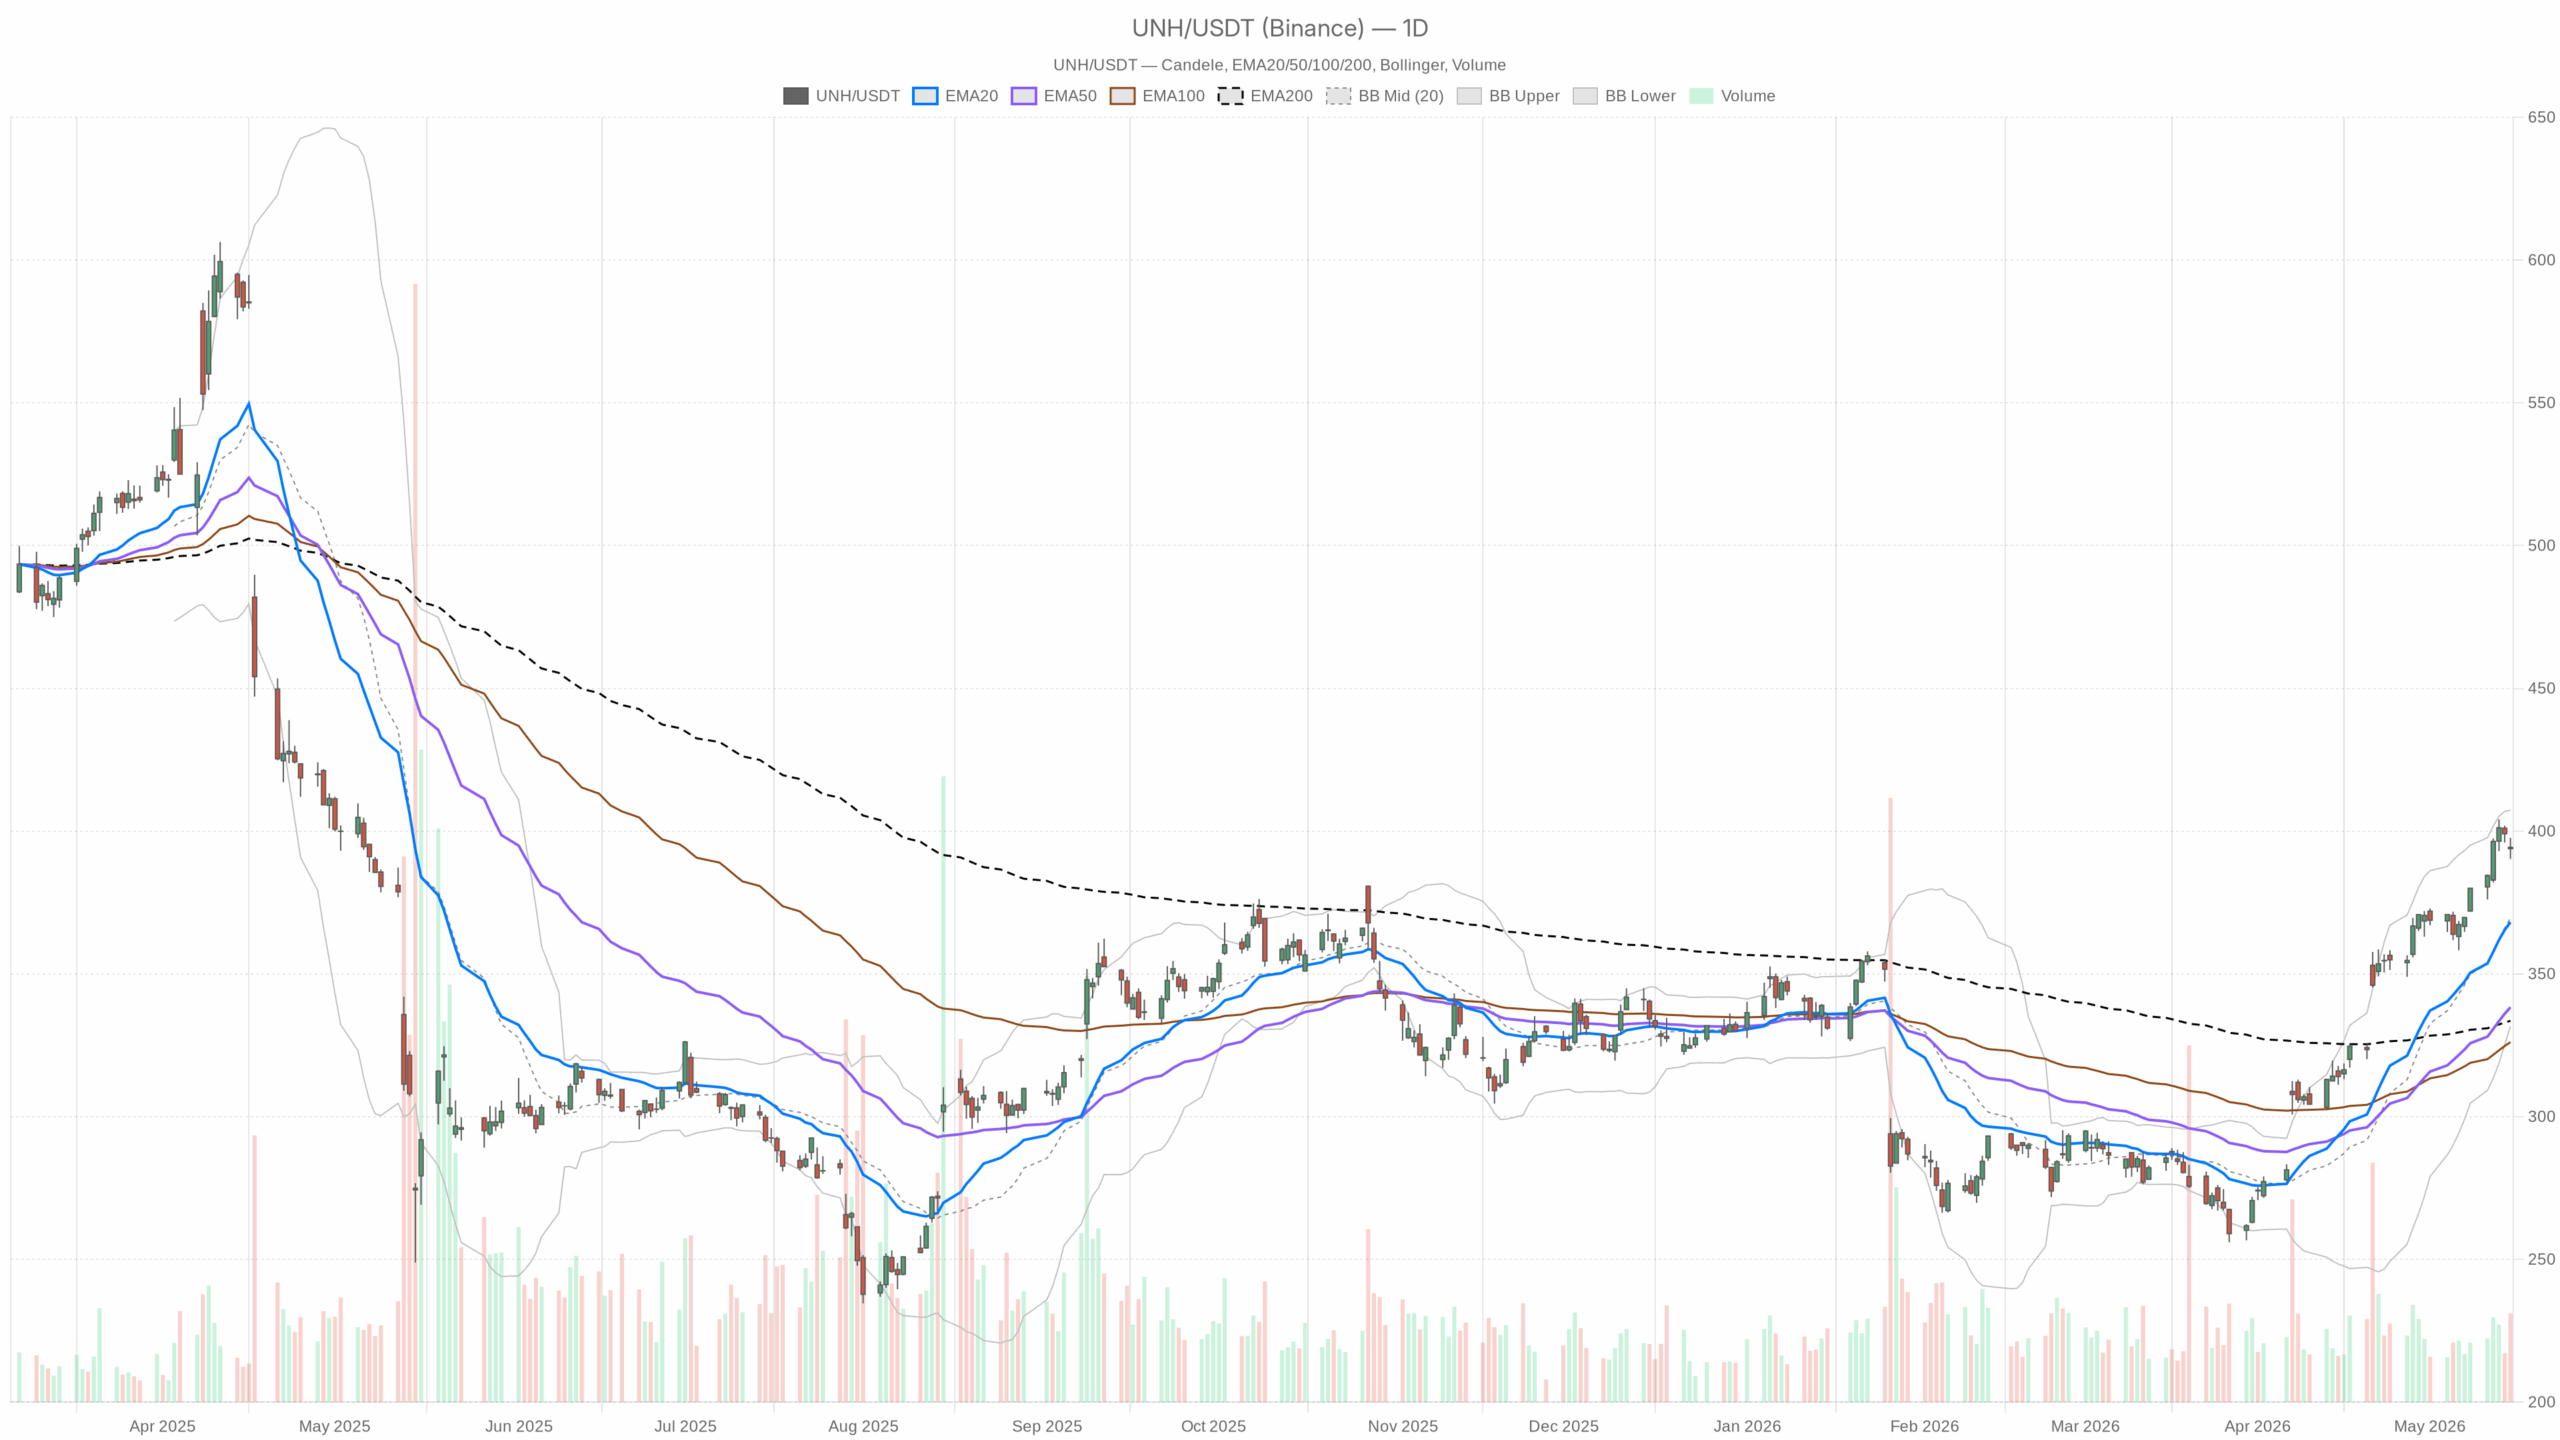 UNH — daily chart with candlesticks, EMA20/EMA50 and volume.
Daily Technicals: Unitedhealth group inc Uptrend Remains Dominant
Trend and Momentum
On the daily timeframe, trend structure is firmly positive. The EMA20 at 368.12, EMA50 at 338.30, and EMA200 at 333.56 are rising and stacked, signaling a durable uptrend. RSI14 at 76.94 is overbought, leaving price vulnerable to a brief pause or shakeout.
Meanwhile, MACD at 21.65 versus a 20.75 signal and a 0.91 histogram keeps an upside bias. However, momentum is no longer accelerating.
Volatility and Pivot Zone
Bollinger Bands place the mid at 369.53, the upper at 407.36, and the lower at 331.69. Price sits in the upper half, leaving room toward 407 while stretched.
Additionally, ATR14 at 9.11 shows elevated daily volatility, so swings can be wide. The daily pivot at 393.91 with R1 397.57 and S1 390.19 marks a classic decision zone. Price closed on the pivot.
1H Chart: Momentum Softens into 390–398
Structure and Levels
On the 1H chart, the EMA20 at 394.52 sits just above price, while the EMA50 at 387.94 remains below. That setup signals short-term digestion inside a larger uptrend. RSI14 at 51.38 is neutral.
In contrast, MACD at 1.18 versus a 2.83 signal and a -1.64 histogram confirms fading intraday momentum. Bollinger mid stands at 397.48, with the upper at 404.32 and lower at 390.65. Price is below the mean, showing seller control near 397.
Meanwhile, ATR14 at 3.16 reflects active yet orderly ranges. The 1H pivot at 393.19, with R1 395.29 and S1 391.71, defines a tight battleground. Price is hovering just above the pivot.
15-Minute Context: Mixed but Stabilizing
Intraday Signals
At the same time, the 15-minute context is mixed but stabilizing. The EMA20 at 392.94 sits below price, while the EMA50 at 394.72 sits above, implying near-term chop with a slight upward tilt.
Still, RSI14 at 51.22 is neutral. MACD at -1.25 versus a -1.53 signal and a 0.28 histogram shows a tentative intraday turn higher.
Bollinger mid is 392.43, with the upper at 394.54 and lower at 390.32. Price leans toward the upper band, indicating a mild bid. ATR14 at 1.29 implies scalp-sized moves. The pivot at 393.25 with R1 395.23 and S1 391.85 keeps 395 in play.
Headlines and Sentiment for UnitedHealth Group Inc
Notably, Berkshire Hathaway exited its UNH stake, and shares slipped premarket. Reporting frames the sale as separate from earnings, guidance, or valuation changes. That points to a sentiment overhang, not a fundamental reset.
Additionally, Bloomberg highlights an internal AI push. It signals operational ambition, yet it is not an immediate chart catalyst for Unitedhealth group inc.
Scenarios and Timeframe Alignment for UNH
Therefore, the bullish scenario still leads on the daily timeframe. Holding above 390–393, then reclaiming the 1H EMA20 394.52 and clearing 395.29 would reassert control. A sustained push through the 1H Bollinger mid near 397.48 and the daily R1 397.57 would open 400. The daily upper band at 407.36 is stretch resistance.
However, the bearish scenario gains traction on repeated rejection in the 395–398 zone. A slip below 391.71 and the daily S1 390.19 would confirm loss of near-term control. In that case, the 1H EMA50 387.94 is a natural waypoint. A deeper pullback toward the daily EMA20 368.12 would mark larger mean reversion. That remains an extended scenario given current strength.
In contrast, timeframes are not aligned today. The daily is bullish, the 1H is neutral with soft momentum, and the 15m shows only a tactical bid. That conflict argues for patience around the 393 pivot until the 1H reverses higher or breaks down. Overall, watch 390–398, the 1H MACD turn, and pivot holds.
Positioning in Unitedhealth group inc now faces elevated volatility and headline noise. The dominant trend is up, but the tape looks tired short term. The next decisive push should emerge from that coil. This is UnitedHealth technical analysis, not advice.


You May Also Like

AI predicts XRP price for April 30, 2026

Justice Department has 'gone off the rails' for Trump's 'pretzel logic': analysis


