

Bitcoin Clears $84K Liquidity as Key Pools Build Near $75K and $70K
Bitcoin clears $84K liquidity as $55M pools build near $75K, $73K and $70K while BTC trades around $80,512.
Bitcoin traded near $80,512 on the daily Bitstamp chart after clearing overhead short-side liquidity between $80,000 and $84,000.
Market attention has now shifted lower, where liquidity pools of more than $55 million are positioned near $75,000, $73,000, and $70,000.
Bitcoin Clears $84K Liquidity Zone
Bitcoin recently moved through the $80,000 to $84,000 area, where overhead short-side liquidity had built up.
This zone was closely watched by traders because liquidity sweeps can shape short-term price action.
The move placed Bitcoin back near the 0.786 Fibonacci retracement level at $80,133. BTC was trading around $80,512, down about 1.15% on the session.
This area now acts as a key technical checkpoint. A daily close above $80,133 may support another attempt toward higher resistance levels.
The next upside level sits near the 0.618 Fibonacci retracement at $88,296. Above that, traders may watch $94,029 and $99,762.
Liquidity Pools Build Near $75K and $70K
After clearing the upper liquidity band, Bitcoin now faces major liquidity below current prices. Data cited by traders shows pools above $55 million near $75,000, $73,000, and $70,000.
These levels may attract market attention during any pullback. Liquidity pools often act as reference points for leveraged traders and short-term market makers.
The $75,000 to $76,000 area is also an immediate support zone on the chart. A move below that range could bring the $73,000 level into focus.
A deeper decline may test the $70,000 region. That level sits close to the broader Fibonacci support near $69,735.
Bitcoin recovered from the lower $60,000 area before reaching the current zone. That recovery remains intact while price holds above major support.
Read Also:
BTC Momentum Remains Positive But Cautious
The MACD indicator remains positive on the daily chart. The MACD line is near 1,953, while the signal line is near 1,793.
The histogram stands near 161, which shows that upward momentum is still present. However, the gap between the two lines remains limited.
This suggests that buyers still have control, but momentum has not expanded strongly. Traders may wait for confirmation above the current resistance area.
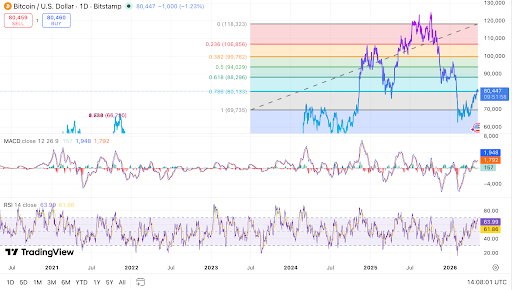 Bitcoin tests resistance as momentum stays positive. Source: TradingView
The RSI is near 64.29, while its moving average is around 61.88. This reading shows firm buying pressure, but it is moving closer to overbought territory.
A move above 70 may show stronger bullish momentum. It may also increase the chance of short-term profit-taking.
Bitcoin’s near-term outlook depends on the $80,133 to $81,000 area. A confirmed daily close above this zone may support a move toward $88,296.
Failure to hold the level may shift attention back to downside liquidity. In that case, $75,000, $73,000, and $70,000 may become the main levels to watch.
The post Bitcoin Clears $84K Liquidity as Key Pools Build Near $75K and $70K appeared first on Live Bitcoin News.


You May Also Like

The changing face of elder care in Malaysia — Sayed Mohammad Reza Yamani Sayed Umar

Not a loophole: Singapore AI export controls let China tap US AI legally

Bitcoin, Gold, and U.S. Stocks Dive as Trump Pledges to Hit Iran ‘Extremely Hard’


