

Solana (SOL) Price: Three Months of Compression May Signal 30% Breakout Rally
TLDR
- Solana is trading near $85, holding above the $80–$85 support zone after months of selling pressure.
- Two chart analysts point to $100, $125, and $135–$145 as potential upside targets if SOL breaks resistance.
- SOL has stayed within a 10% range for three months, with analyst Daan Crypto Trades expecting a 20–30% move once it breaks.
- On-chain data from Santiment shows active addresses have dropped from 5.01M to 2.89M per week, but social sentiment has hit its highest level since January.
- Key resistance sits at $90–$92; a break above could accelerate price movement, while a loss of $80 support would signal further downside.
Solana is trading near $85 after months of sideways action following a steep decline from its November and January highs. The price has been moving inside a tight range, with buyers defending the $80–$85 support zone and sellers capping each recovery attempt.
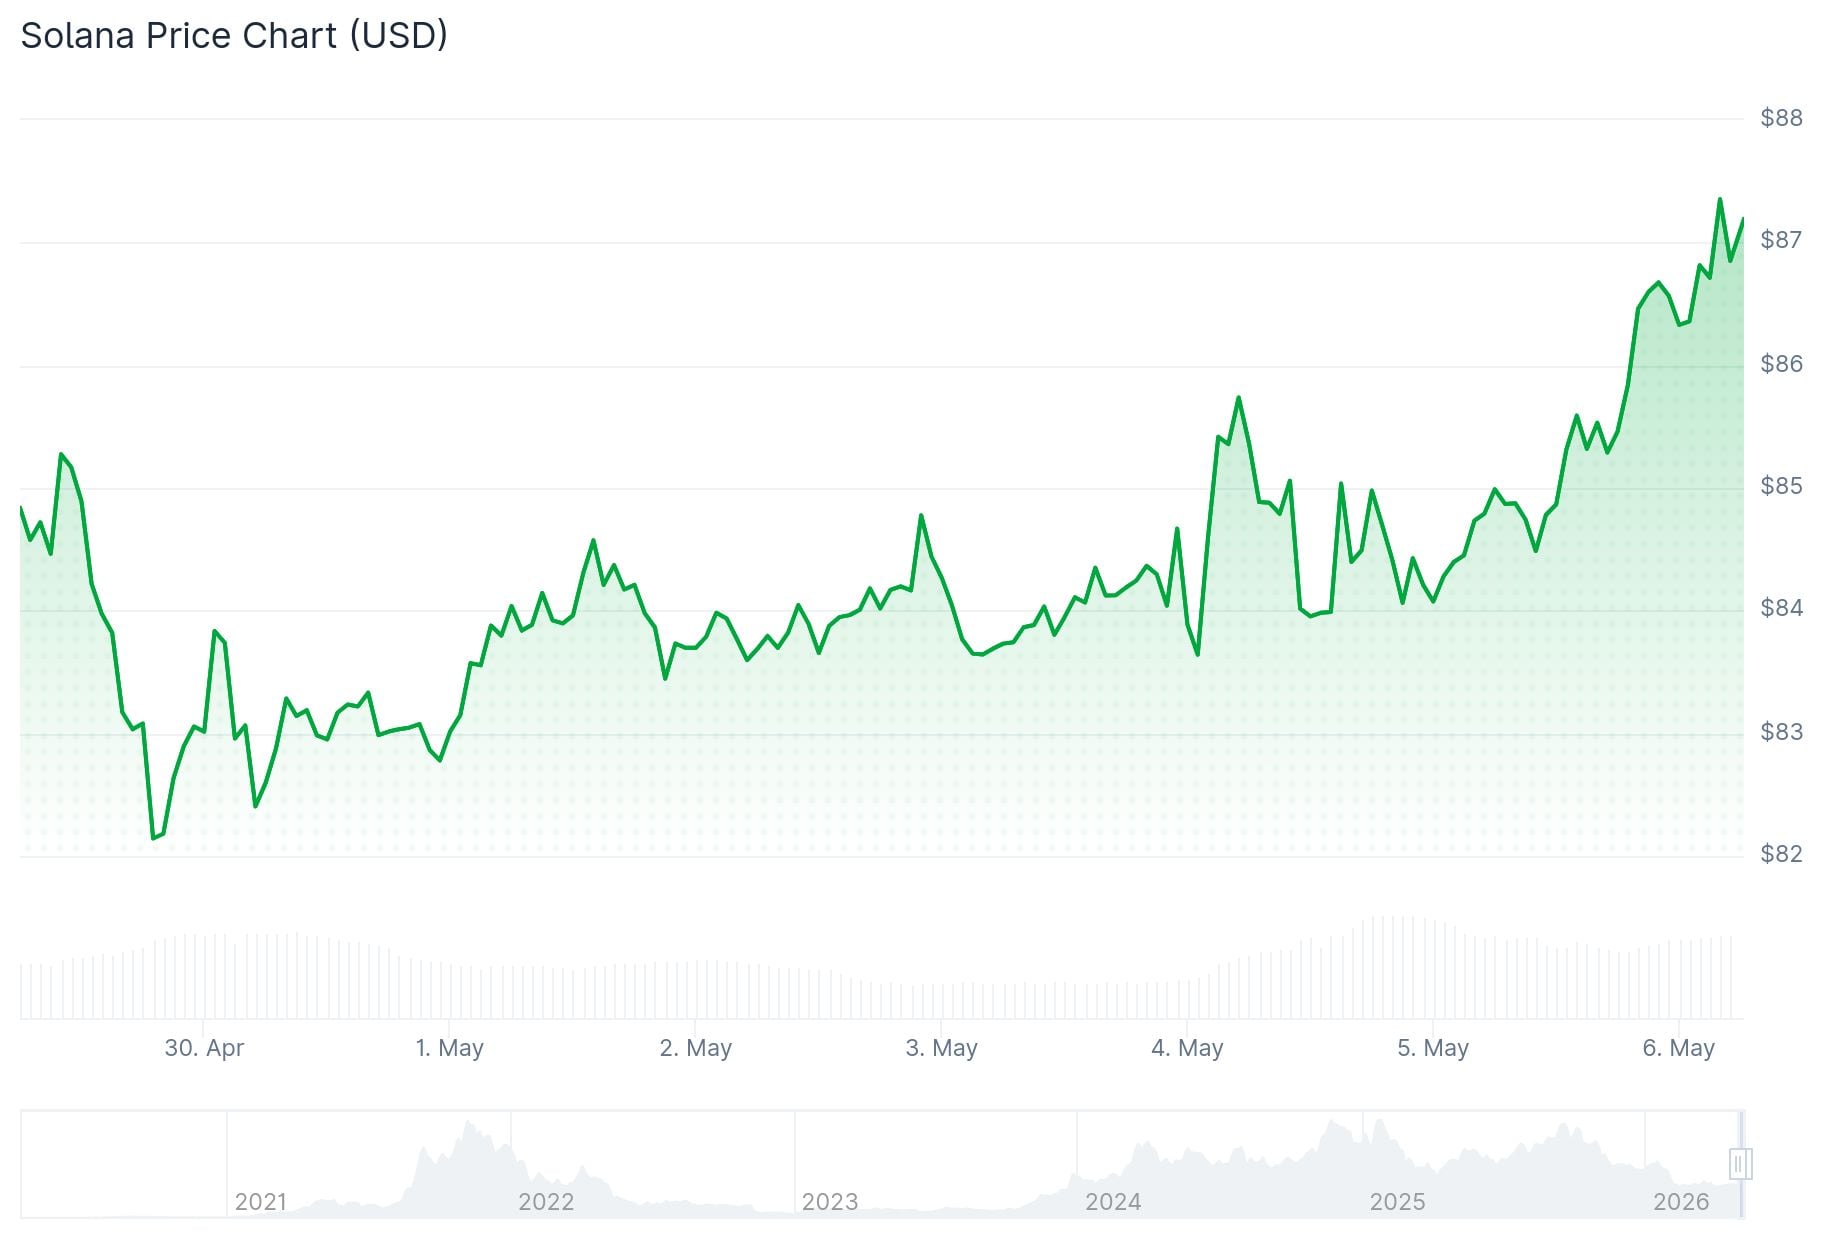 Solana (SOL) Price
Two chart analysts, WebTrend and Ray, have both published analysis pointing to $100 as a near-term target if SOL can break above current resistance. WebTrend’s chart shows SOL forming two rounded support reactions — one near the February low and another around early April — suggesting sellers lost momentum near the same price zone.
Ray’s chart shows SOL compressing inside a triangle pattern, with lower highs and higher lows forming between roughly $70 and $97. Ray said he expects SOL to move above $100 “very soon,” though the setup depends on a clean break above the upper triangle trendline near $85–$90.
A successful breakout above that trendline could target the March high near $97, and then $100. Ray’s chart also marks $125 as a later target if SOL holds above the breakout zone.
What the Indicators Are Saying
Analyst Daan Crypto Trades added further context, noting that SOL has stayed within a 10% price range for three months. He said this kind of prolonged compression typically leads to a strong move and expects a minimum 20–30% move once the range breaks. He added that the direction will depend on which side gives way first.
Technical indicators back up the consolidation picture. The RSI sits near 53, showing neutral conditions. The MACD on the daily chart is flat with no clear directional signal. The 200 EMA sits near $112, well above the current price, which points to ongoing long-term bearish pressure.
Futures data from CoinGlass shows volume fell about 37.88% over 24 hours, while open interest rose 3.87%, meaning traders are still taking positions despite lower activity. Total liquidations over the same period came to around $2.23 million, with short liquidations making up roughly $1.84 million of that.
What On-Chain Data Shows
Santiment data shows Solana’s weekly active addresses have dropped from a peak of 5.01 million in early February to just 2.89 million in the most recent week. Santiment noted that fewer wallets are currently transferring SOL. At the same time, social sentiment has jumped to its highest level since January. Santiment’s data shows roughly 3.2 bullish comments for every 1 bearish comment across platforms including X, Reddit, and Telegram.
Major resistance is at $90–$92 based on recent price action. Support sits near $80. If SOL loses the lower triangle trendline around $80–$82, price could revisit the $70–$75 area.
SOL’s 200 EMA remains at approximately $112, and the price is currently trading about 24% below that level.
The post Solana (SOL) Price: Three Months of Compression May Signal 30% Breakout Rally appeared first on CoinCentral.


You May Also Like

Top U.S. economist says Gold reversal is imminent

Crypto Hack: Drift Protocol Drained Over $200M in Private Key Breach

Bitcoin treasury sell-off accelerates as Riot, Bhutan, and public companies exit positions


